Are You Trading the Right Sector for 2025?

Author: Brijesh Bhatia (@bbrijesh9
Pune, 07 January 2025: Traders and investors often constantly search for the perfect entry point—buying at the bottom and selling at the top. Though it is an exciting proposition, the point to ponder is but how often does one get it right?
The truth is that timing the market perfectly is nearly impossible. Successful traders know the importance of following a process rather than relying solely on instinct or speculation.
A sectoral index that has caught our attention, which could be a potential opportunity for 2025, is the Definedge Chemicals – Dyes & Pigments Index.
Definedge Chemicals – Dyes & Pigments Index
The Definedge Chemicals—Dyes & Pigments Index is an equal-weighted index that tracks the performance of nine companies in the dyes and pigments business. Most of these companies fall within the micro– and small-cap segments, making them highly sensitive to market fluctuations and ripe for substantial growth opportunities.
In 2024, indices like Nifty Microcap and Nifty SMLCAP250 outperformed the flagship Nifty50, signalling a shift towards smaller, more nimble stocks. Given this momentum, we expect the trend to continue into Q1 2025.
Does the chart support the trend?
Definedge Chemicals – Point & Figure (P&F) Chart
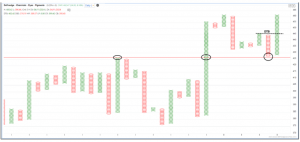
Source: Zone Web, Definedge Securities
The Definedge Chemicals Index’s Point & Figure (P&F) chart presents an encouraging outlook. The index has re-tested the breakout level after initially surging, and the trend is currently bullish, as reflected in the current lengthy X-column in the P&F chart. This indicates the presence of strong upward momentum.
More importantly, the Double-Top Buy (DTB) pattern in the chart indicates the completion of a bullish swing breakout. The retested area acted as a demand zone, further validating the bullish trend’s continuation.
Definedge Chemicals – Candlestick Chart
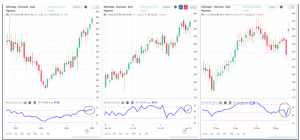
Source: TradePoint, Definedge Securities
We get a clearer picture when we switch to the candlestick chart and use multi-frame analysis across Monthly, Weekly, and Daily intervals. Traditionally, the RSI (Relative Strength Index) has a threshold of 70 for overbought conditions and 30 for oversold conditions. However, we adopt a slightly different approach.
We believe that the trend remains strong when the RSI is above 60. Specifically, when the RSI is above 60 on both the monthly and weekly charts, the trend is positive, while the daily chart reflects momentum.
In the case of the Definedge Chemicals Index, the RSI on the monthly, weekly and daily charts is comfortably above 60, signalling strong trend strength and positive momentum. This confirms that the sector is poised for potential further gains.
Two Stocks That Could Drive the Index Higher
Now, let us focus on two key stocks within the Definedge Chemicals Index that we believe could propel the index higher: Chambal Fertilizers and Sudarshan Chemicals.
Chambal Fertilizers
Chambal Fertilizers has been a solid performer in the chemical sector and stands out within the index.
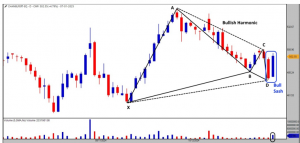
Source: TradePoint, Definedge Securities
A Bullish Gartley Harmonic pattern is visible on the daily chart, indicating that the bulls are seizing the opportunity as the stock price dips. The Gartley pattern often signals potential reversals, and in this case, it suggests that the stock is setting up for a possible upward move.
Additionally, the Bullish Sash candlestick pattern adds weight to this analysis. This bullish reversal pattern, combined with rising volumes, confirms that the stock may see further upside if it experiences a slight dip in price. Traders should keep an eye out for any pullbacks as potential entry points.
Sudarshan Chemicals
Sudarshan Chemicals is another stock that could raise the Definedge Chemicals Index. This company has been a consistent player in the pigments and dyes sector and has a promising technical setup on the charts.
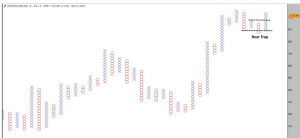
Source: TradePoint, Definedge Securities
A Bear Trap pattern is clearly visible on the 3% X 3 Point & Figure (P&F) chart. This pattern typically occurs when prices dip, and bearish traders who short the stock are trapped as the market quickly reverses. In mid-2024, a dip trapped many bears, but the subsequent follow-up breakdown and a strong reversal in the months following signal a resumption of the bullish trend.
Given the chart’s indication of a strong reversal, the dip earlier in 2024 could represent a prime buying opportunity for traders looking for an entry point on a continued upward trajectory.
Are you timing the trades with Charts?
The Definedge Chemicals – Dyes & Pigments Index is currently showing strong bullish signals. The sector’s performance, especially the smaller-cap stocks that have been gaining momentum in 2024, suggests that this trend will likely continue into 2025.
This sector offers compelling opportunities with promising patterns forming on both the Point & Figure and Candlestick charts. Chambal Fertilizers and Sudarshan Chemicals, in particular, present favourable setups for potential growth within the index.
If you are a trader or investor who believes in following the chart rather than relying on gut instinct, the Definedge Chemicals Index might be an area worth focusing on in the new year.
Disclaimer: The purpose of this article is only to share interesting charts, data points and thought-provoking opinions. It is NOT a recommendation. This article is strictly for educative purposes only.
As per SEBI guidelines, the writer and his dependents may or may not hold the stocks/commodities/cryptos/any other assets discussed here. However, clients of Definedge may or may not own these securities.
About Writer:
Brijesh Bhatia has over 18 years of experience as a trader and technical analyst in India’s financial markets. He is a well-known face in the business channel as a Market Expert and has worked with broking giants like UTI, Asit C Mehta, and Edelweiss Securities. He is currently a Senior Research Analyst and Editor at Definedge.