
Pune records highest-ever half-year office leasing in H1 2026; Residential sales remain resilient as launches rise 17% YoY
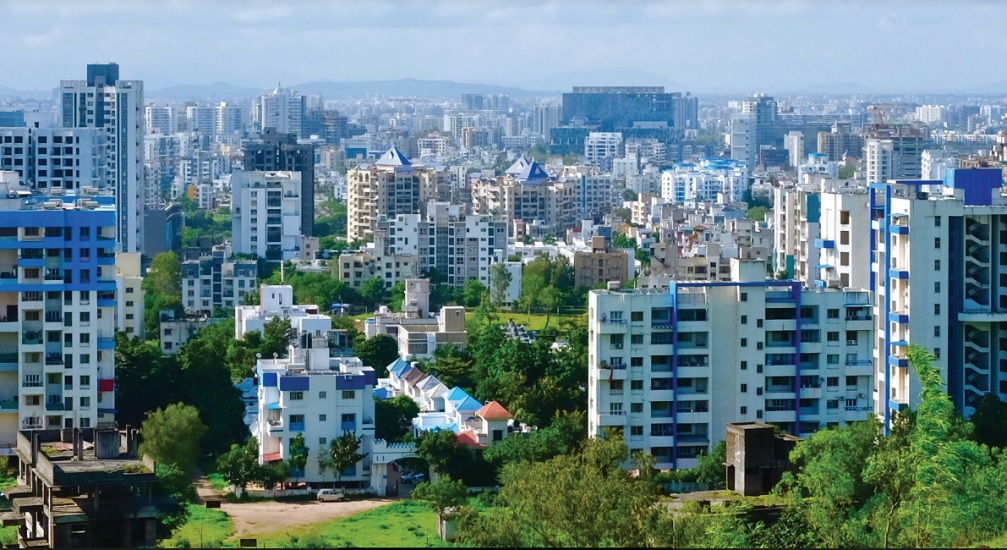
Pune, 9th July 2026: Knight Frank India, in its latest report, India Real Estate H1 2026, highlighted Pune’s continued real estate momentum, with the city recording its highest-ever half-year office leasing volume while maintaining healthy residential demand during the first half of 2026.The office market witnessed gross leasing transactions of 6.6 mn sq ft, registering a 29% year-on-year (YoY) increase despite a high base in the corresponding period last year. The growth was driven by strong occupier demand from Global Capability Centres (GCCs), flex operators and third-party IT/ITeS companies, supported by larger deal sizes and sustained demand for Grade A office developments.
On the residential front, Pune continued to witness healthy end-user demand with 24,890 housing units sold during H1 2026, a 2% YoY increase. Developers remained confident about the market outlook, launching 31,116 new housing units, reflecting a 17% YoY growth. Residential prices also continued their upward trajectory, increasing 5% YoY to an average of INR 10,063 per sq ft.
Office Market Highlights 0f Pune
PUNE OFFICE MARKET SUMMARY
| Parameter | H1 2026
Mn sq ft |
H1 2026
Change (YoY) |
| Completions in mn sq ft | 3.9 mn sq ft | -55% |
| Transactions in mn sq ft | 6.6 mn sq ft | 29% |
| Average transacted rent in INR/sq ft/month | INR 81.7/sq ft/month | 6% |
Note: 1. 1 square metre (sq m) = 10.764 square feet (sq ft), Source: Knight Frank Research
Pune’s office market recorded its strongest half-year leasing performance on record during H1 2026, underlining the city’s growing importance as one of India’s leading commercial office destinations. Gross office transactions stood at 6.6 mn sq ft, driven by sustained occupier demand across multiple sectors despite elevated leasing levels in the previous year. The increase in leasing activity was supported by several large-format transactions from Global Capability Centres (GCCs), flex operators and third-party IT/ITeS firms. Campus-style office developments across Kharadi, Hinjawadi and Baner continued to attract occupiers seeking scalable Grade A office space.
While office demand strengthened, new office completions moderated to 3.9 mn sq ft, a decline of 55% YoY following record supply additions in the previous year. The moderation in fresh supply, coupled with sustained leasing activity, resulted in the city’s vacancy level declining by 80 basis points to 14.1%, indicating improving market fundamentals.
The occupier profile remained well diversified during H1 2026. Flex operators emerged as the largest occupier segment, accounting for 33% of leasing activity, followed closely by Global Capability Centres at 32%, up from 25% a year ago. GCC demand was led by occupiers across the BFSI, manufacturing, engineering and technology sectors, signalling the continued expansion and diversification of Pune’s GCC ecosystem beyond its traditional IT base. Third-party IT/ITeS companies contributed 16% of leasing activity, while India-facing businesses accounted for the remaining 19%.
| End-User Licensee/Buyer | Flex | India-Facing Business | Third Party IT | GCC | Total |
| Area transacted in mn sq ft | 2.19 | 1.24 | 1.0 | 2.1 | 6.6 |
Source: Knight Frank Research
Leasing activity also became more geographically diversified across Pune’s business districts. Peripheral Business District (PBD) West emerged as the city’s largest office destination, accounting for 33% of transactions, more than doubling its share compared to H1 2025, supported by large contiguous office spaces in Hinjawadi and Wakad. PBD East remained another key office hub, while SBD East increased its share to 26%, reflecting growing occupier interest across multiple office corridors.
Average office rentals increased 6% YoY to INR 81.7 per sq ft per month, reflecting sustained occupier demand for quality office assets despite ongoing development activity across the city.
Vilas P Menon, National Director – Occupier Services, Capital Markets & Branch Head – Pune, Knight Frank India said, “Pune’s office market continues to demonstrate remarkable resilience, recording its strongest half-year leasing performance to date. Robust demand from GCCs, flex operators and technology-led occupiers, coupled with improving infrastructure and expanding metro connectivity, reinforces the city’s position as one of India’s most preferred commercial destinations. As a healthy supply pipeline comes on stream, Pune remains well placed to sustain its long-term growth trajectory.”
Looking ahead, Pune’s office market is expected to benefit from continued infrastructure investments, including the phased rollout of Metro Line 3 connecting Hinjewadi and Shivajinagar, planned metro expansion towards Kharadi and Hadapsar, and a healthy office supply pipeline expected during the second half of the year. These developments, alongside continued GCC expansion, are expected to support demand across both established and emerging office districts.
Residential Market Highlights of Pune
Pune’s residential market maintained healthy momentum during H1 2026, supported by sustained end-user demand and strong developer confidence. Housing sales increased by 2% YoY to 24,890 units, while new launches rose at a faster pace by 17% YoY to 31,116 units, with developers focusing on Pune’s western and eastern growth corridors where employment hubs and improving connectivity continue to drive demand.
PUNE RESIDENTIAL MARKET SUMMARY
| Parameter | H1 2026 | H1 2026
Change% (YoY) |
| Launches (housing units) | 31,116 | 17% |
| Sales (housing units) | 24,890 | 2% |
| Average price in INR/sq ft | INR 10,063/sq ft | 5% |
Note: 1 square metre (sq m) = 10.764 square feet (sq ft), Source: Knight Frank Research
Residential price appreciation remained broad-based across Pune’s key micro-markets, with the city’s average residential price increasing 5% YoY to INR 10,063 per sq ft. Locations such as Baner, Kharadi and Hinjewadi continued to witness healthy buyer interest owing to their proximity to major employment centres, improving connectivity and projects offering larger homes and enhanced lifestyle amenities.
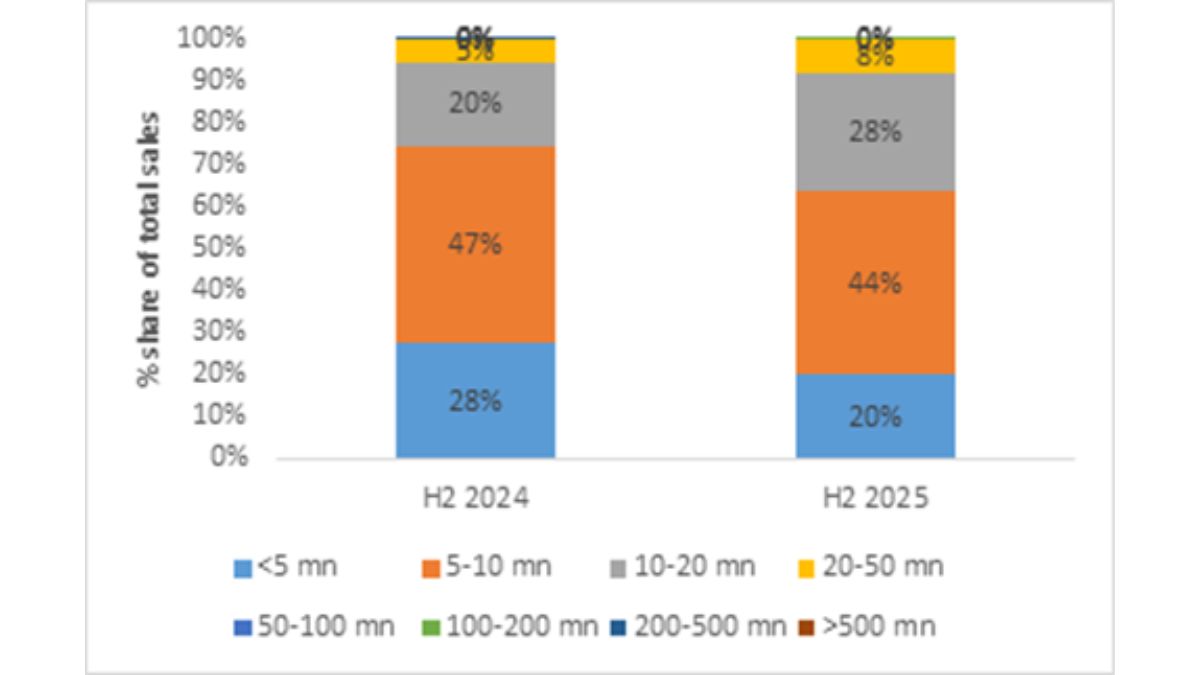
The composition of housing demand continued to move towards higher-value homes during H1 2026. The share of homes priced below INR 5 mn declined, while the INR 5–10 mn and INR 10–20 mn categories accounted for a larger share of overall sales. Demand for homes priced above INR 20 mn also remained steady, reflecting the continued preference among buyers for larger and premium residential developments.
Pune ticket size split comparison of sales during H1 2025 and H1 2026
Source: Knight Frank Research
During H1 2026, Pune accounted for the highest YoY percentage growth in luxury housing across the leading eight metros in the country. The city witnessed a growth of 54% YoY in the INR 20-50 mn segment. The ticket size of below INR 5mn saw a drop of -8%.
TICKET-SIZE SPLIT OF SALES
| Ticket Size Categories | <5 mn | 5-10 mn | 10-20 mn | 20-50 mn | 50-100 mn | 100-200 mn | 200-500 mn
|
Total |
| H1 2024 | 5,013 | 10,841 | 6,990 | 1,957 | 87 | 2 | – | 24,890 |
| YoY
% change |
-25% | -5% | 42% | 54% | 67% | -89% | NA | 2% |
Source: Knight Frank Research
Pune West remained the city’s largest residential market during the period, led by Hinjewadi, Wakad, Baner and Mahalunge, while Pune East, anchored by Kharadi, Wagholi and Hadapsar, continued to account for a significant share of residential activity. Together, these two corridors remained the primary centres of housing demand, supported by established employment hubs, expanding infrastructure and a steady pipeline of new residential developments.
Launch activity also remained concentrated across Pune’s western and eastern growth corridors, with Hinjewadi, Tathawade, Wakad and Kharadi accounting for a significant share of new residential supply, highlighting continued developer preference for locations benefiting from employment-led demand and improving connectivity.
While increased project launches led to unsold inventory rising 19% YoY to 57,879 units, market absorption remained healthy. The city-wide Quarters-to-Sell (QTS) stood at 4.5 quarters, indicating that the rise in inventory has largely been driven by higher launches rather than weakening demand. Among various ticket-size categories, the INR 5–10 mn segment continued to record the healthiest market conditions with a QTS of 1.9 quarters.
Vilas P Menon, National Director, Occupier Services, Capital Markets & Branch Head, Pune, Knight Frank India said “Pune’s residential market continues to benefit from healthy end-user demand, supported by sustained employment generation, improving connectivity and strong developer confidence. Buyers are increasingly gravitating towards larger and higher-value homes across established growth corridors, while continued infrastructure investments are expected to further strengthen demand across both established and emerging micro-markets.”
Looking ahead, Pune’s residential market is expected to continue benefiting from ongoing infrastructure investments, particularly the expansion of metro connectivity along the Hinjewadi–Shivajinagar corridor, together with improvements across the city’s eastern and western growth corridors. Supported by sustained employment generation across the GCC, manufacturing and technology sectors, and Pune’s relative affordability compared to larger metropolitan markets, these developments are expected to support residential demand across both established and emerging locations.