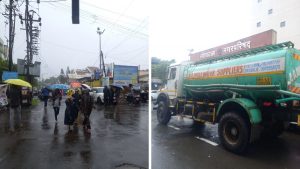
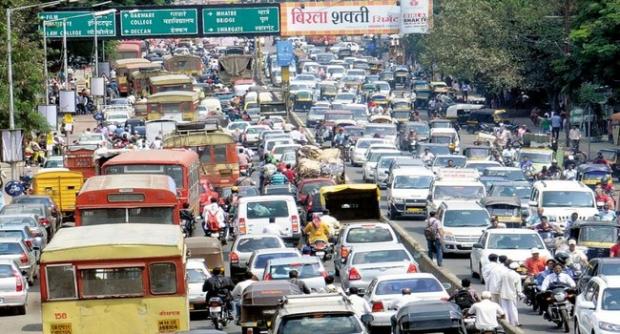
Pune is amongst the ‘Most Traffic Congested City’ in World
Pune, January 30, 2020 – Location technology specialist, TomTom (TOM2), today released the results of the TomTom Traffic Index, a report detailing the traffic situation in 416 cities in 57 countries. Pune takes the 5th spot this year with 59% congestion level (extra travel time stuck in traffic). On an average, Punekars driving during peak hours spend an extra 193 hours, i.e., 8 days, 1 hour in traffic each year. The city’s heaviest congestion (93%) was recorded on August 2, 2019, while its lowest congestion (30%) was recorded on October 27, 2019.
At 4th position, Mumbai is the other city from Maharashtra to be featured amongst the global top 5 congested cities. The city’s congestion level stood at 65%. On an average, Mumbaikars driving during peak hours spend an extra 209 hours, i.e., 8 days, 17 hours in traffic each year. Mumbai’s heaviest congestion (101%) was on September 9, 2019, while its lowest congestion (19%) was recorded on March 21, 2019.
India topped the TomTom Traffic Index 2019 with 4 of its cities amongst the 10 most congested cities globally with Bengaluru as the top most congested city in the world with 71% congestion level while Mumbai (65%), Pune (59%) and New Delhi (56%) ranks 4th, 5th and 8th respectively. The other global cities featured amongst the top 10 include Manila from The Philippines, Bogota from Colombia, Moscow from Russia; Lima from Peru, Istanbul from Turkey, and Jakarta from Indonesia.
Congestion level across Indian Cities
Bengaluru: On an average, Bengalureans driving during peak hours, spend an extra 243 hours, i.e., 10 days, 3 hours in traffic each year. The city’s heaviest congestion (103 %) was on August 20, 2019, while its lowest congestion (30%) was on April 6, 2019.
New Delhi: On an average, Delhiites driving during peak hours spend an extra 190 hours, i.e., 7 days, 22 hours in traffic each year. The city’s heaviest congestion (81%) was recorded on October 23, 2019, while its lowest congestion (6%) was recorded on March 21, 2019.
Congestion up, globally: At what cost?
Traffic congestion has increased globally during the last decade, and 239 cities (57%) TomTom included in the new Traffic Index report had increased congestion levels between 2018 and 2019, with only 63 cities showing measurable decreases. This global increase in congestion, despite being an indicator of a strong economy, also costs economies billions.
Werner van Huyssteen, General Manager, TomTom India, said: “Globally, there’s a long road to travel until congestion levels are brought under control. In time, the car-sharing services will help alleviate congestion, however, planners and policymakers need to use all the tools available to them to analyse traffic levels and impacts, so they can make critical infrastructure decisions.”
Analyzing real-time incidents and congestion to predict traffic before it happens, TomTom’s Real-Time Traffic makes TomTom navigation software more accurate with enhanced route calculations and accurate estimated times of arrival (ETA). That’s why TomTom is the market leader, with its traffic technology in millions of cars on the road around the world. TomTom Traffic knows the road ahead, saving time, fuel and stress for drivers, fleet and logistics providers, on-demand services (ride hailing, food delivery), and traffic management services.
And the location technology specialist’s work on the future of driving – from high definition maps for autonomous vehicles, to efficient electric vehicle routing and charging – means that car makers, technology companies, road authorities and governments already have the tools to make the roads less congested.
People can find out more about the TomTom Traffic Index, and discover where their home city ranks at tomtom.com/TrafficIndex. There’s also helpful advice on beating traffic congestion.
How do you beat traffic congestion?
Next time you are heading into traffic, consider these helpful tips:
1. Plan before you go. Taking a few moments before heading out the door to inform yourself on the road conditions on the way to your destination will help you consider your alternatives and decide on the best course of action.
2. Trust technology to help you. It may be uncomfortable to take the road less traveled simply because your satnav suggests it’s the fastest one. Often, if you cannot see that a road is indeed congested, it is hard to believe it. Dare to take the alternative route offered by up-to-date navigation, because it is basing its recommendation on real-time traffic conditions on the route you are taking.
3. Change your driving habits. Most often, traffic will peak at certain times of the day, depending on location. This is clear in each of the city pages in the TomTom Traffic Index report, where we provide the average congestion level for each hour of each day of the week. Use the information available to adjust your departure time accordingly. Leaving early or late from a location might mean avoiding time spent in traffic on the road.
4. Consider alternatives. Does your trip have to be made by car? If your planned activity is time-sensitive and you cannot change your departure times, consider ride-sharing, public transport or non-motorized options such as cycling or scooters.
5. Work with your city. Ultimately, improving mobility in our cities is a collaborative effort. Together, city authorities, vehicle manufacturers, traffic signal system providers, parking facilities, traffic information providers, shared mobility providers, startups and, most importantly, the public, are experimenting and transforming cities worldwide. Inform yourself of the initiatives taking place in your urban area and how you can benefit from them.
Ranking of the most congested cities Globally (Overall daily congestion level – extra travel time – population over 800,000):
| 1 | Bengaluru, India | 71% | 6 | Moscow, Russia | 59% |
| 2 | Manila, Philippines | 71% | 7 | Lima, Peru | 57% |
| 3 | Bogota, Colombia | 68% | 8 | New Delhi, India | 56% |
| 4 | Mumbai, India | 65% | 9 | Istanbul, Turkey | 55% |
| 5 | Pune, India | 59% | 10 | Jakarta, Indonesia | 53% |
Ranking of the most congested cities in Europe (Overall daily congestion level – extra travel time – population over 800,000):
| 1 | Moscow, Russia | 59% | 6 | Dublin, Ireland | 48% |
| 2 | Istanbul, Turkey | 55% | 7 | Odessa, Ukraine | 47% |
| 3 | Kyiv, Ukraine | 53% | 8 | Novosibirsk, Russia | 45% |
| 4 | Bucharest, Romania | 52% | 9 | Samara, Russia | 44% |
| 5 | Saint Petersburg | 49% | 10 | Kharkiv, Ukraine | 43% |
Ranking of the most congested cities in United States of America (Overall daily congestion level – extra travel time – population over 800,000):
| 1 | Los Angeles, USA | 42% | 6 | Miami, USA | 31% |
| 2 | New York, USA | 37% | 7 | Washington, USA | 29% |
| 3 | San Francisco, USA | 36% | 8 | Chicago, USA | 28% |
| 4 | San Jose, USA | 33% | 9 | Honolulu, USA | 28% |
| 5 | Seattle, USA | 31% | 10 | Austin, USA | 27% |
Ranking of the most congested cities in South America (Overall daily congestion level – extra travel time – population over 800,000):
| 1 | Bogota, Colombia | 68% | 6 | Santiago, Chile | 44% |
| 2 | Lima, Peru | 57% | 7 | Salvador, Brazil | 43% |
| 3 | Recife, Brazil | 50% | 8 | Fortaleza, Brazil | 37% |
| 4 | Rio De Janeiro | 46% | 9 | Belo Horizonte, Brazil | 35% |
| 5 | Sao Paolo | 45% | 10 | Porto Alegre, Brazil | 35% |
Ranking of the most congested cities in Asia (Overall daily congestion level – extra travel time – population over 800,000):
| 1 | Bengaluru, India | 71% | 6 | Jakarta, Indonesia | 53% |
| 2 | Manila, Philippines | 71% | 7 | Bangkok, Thailand | 53% |
| 3 | Mumbai, India | 65% | 8 | Tel Aviv, Israel | 46% |
| 4 | Pune, India | 59% | 9 | Tokyo, Japan | 42% |
| 5 | New Delhi, India | 56% | 10 | Chongqing, China | 41% |
Ranking of the most congested cities in Africa (Overall daily congestion level – extra travel time – all population sizes):
| 1 | Cairo, Egypt | 40% | 6 | Durban, S. Africa | 19% |
| 2 | Cape Town, S. Africa | 32% | 7 | Bloemfontein, S. Africa | 13% |
| 3 | Johannesburg, S. Africa | 30% | |||
| 4 | Pretoria, S. Africa | 25% | |||
| 5 | East London, S. Africa | 22% |
Ranking of the most congested cities in Australia and Oceania (Overall daily congestion level – extra travel time – all population sizes):
| 1 | Sydney, Australia | 33% | 6 | Brisbane, Australia | 25% |
| 2 | Auckland, New Zealand | 31% | 7 | Adelaide, Australia | 24% |
| 3 | Melbourne, Australia | 30% | 8 | Gold Coast, Australia | 24% |
| 4 | Wellington, New Zealand | 28% | 9 | Hobart, Australia | 23% |
| 5 | Hamilton, New Zealand | 25% | 10 | Christchurch, New Zealand | 21% |
*of cities with a population of more than 800,000