Pune registers 25% YoY rise in residential sales; 21,797homes sold in H1 2022: Knight Frank India
Mumbai, July 06, 2022: Knight Frank India in its latest report, India Real Estate: H1 2022 (January to June 2022) cited that homes sales in Pune increased by 25%YoY to be recorded at 21,797housing units in H1 2022.This was the highest half-yearly sales witnessed since 2012. H1 2022 has already achieved almost 60% of the annual sales of 2021. This is a significant milestone despite the implementation of metro cess and hike in ready reckoner rates observed during the period.
Pune’s residential space was dominated by the South and East micro markets accounting fora market share of 34% and 27%respectively of the total sales during H1 2022. The average price in Pune’s residential market increased by 6% to INR 4,242 per sq ft in H1 2022.
In terms of office market performance, the half-yearly period from January to June 2022 witnessed a strong revival in transaction volumes. H1 2022 recorded a Year-on-Year (YoY) growth of 187% with 3.3 mnsq ft and was the highest in terms of area transacted since H1 2019. New office completions were recorded at5.0mnsq ft during the same period.
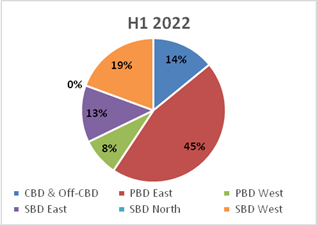
The average transacted rent escalated by 8% YoY in H1 2022. The rental movement was primarily driven by demand concentrated micro-markets of Peripheral Business District-East and Secondary Business District – West. The Business district-wise transactions in the Peripheral Business District (PBD) East grew from 3% in H1 2021 to 43% in H1 2022.
RESIDENTIAL MARKET UPDATE: H1 2022 (JANUARY – JUNE 2022)
From the aspect of the residential price movement, improved household incomes along with greater willingness on the part of homebuyers to purchase a property have givendevelopers facing increased input costs the comfort to raise property prices. This hasled to an increase in Pune’s average residential prices by 6% YoY during H1 2022.
With the sales outpacing new launches, the unsold inventory has seen a dip of 8% with a quarters-to-sell (QTS) of 4.9 quarters.
From the aspect of the micro-market split, demand for housing was concentrated in the South and East micro-markets of Pune, with 34% of sales in H1 2022 recorded in the South ,and 27% recorded in the East micro markets. To date, these micro-markets continue to enjoy high demand as a large section of Pune’s homebuyers comprise the Information Technology (IT) workforce who are looking for housing near the employment hubs. Followed by the East, the West Pune micro-market holds a market share of 22% while Central and North micro markets collectively hold a share of 17% commanding the lowest demand.

From the aspect of price category, the share of ticket sizes < INR 5 mn continued to favour the homebuyers’ accounting for 50% of the overall sales in H1 2022, which declined marginally from the 51% share recorded in H1 2021.Since H1 2018, the mid-segment share of 5-10 million homes has increased sequentially, from 28% in H1 2018 to 41 % in H1 2022. The Luxury homes costing above INR 10 million also showed considerable traction, with a 9 percent share take-up in H1 2022.
PUNE RESIDENTIAL MARKET SUMMARY
| Parameter | 2021 | 2021 Change (YoY) | H1 2022 | H1 2022 Change (YoY) |
| Launches (housing units) | 40,489 | 16% | 17,393 | -15% |
| Sales (housing units) | 37,218 | 38% | 21,797 | 25% |
| Average Price in INR/ sq ft | INR 4,000 | -0.4% | INR 4,242 | 6% |
Source: Knight Frank Research
Paramvir Singh Paul, Branch Director – Pune, Knight Frank India said, “Pune’s residential market has seen a robust performance in H1 2022. Despite implementation of the metro cess effectively raising the stamp duty by 1 percentage point, and the hike in Ready Reckoner rates (RR rates) by 6.12% in Pune city under PMC, and 12.36% in Pimpri Chinchwad under PCMC effective 1st April 2022, consumer sentiment remains unaffected as the sales momentum shows strong growth. However, against the backdrop of heightened uncertainty around Omicron in Q1 2022 and the rising input costs in Q2 2022, developers are being cautious while introducing new supply in the market.”
PUNEOFFICE MARKET SUMMARY
| Parameter | 2021 | 2021 Change (YoY) | H1 2022 | H1 2022 Change (YoY) |
| Completions in mnsq m (mnsq ft) | 7.2 | 921% | 5.0 | 73% |
| Transactions in mnsq ft | 3.8 | 3% | 3.3 | 187% |
| Average transacted rent in INR/sq ft/month | 67.0 | -4% | 71.0 | 8% |
Source: Knight Frank Research
From the sector-wise transaction split in H1 2022, the Other Services that constitute e-commerce, consultancy, media, and engineering amongst others currently constituted the majority of Pune’s transaction volume with an increase in share contribution from 13% in H1 2021 to 55% in H1 2022. Whereas, the Co-working deals also continued to hold a large market share in Pune accounting for 31% of overall office transactions.
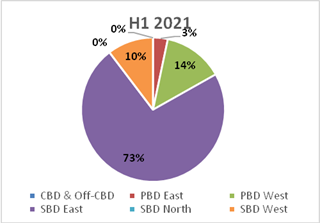
From the aspect of Micro-markets split in sales, Demand in H1 2022 was dominated by the Other Services having a share of 55% of the total transactions which include e-commerce, consultancy, media, and engineering amongst others. Co-working transactions continued to dominate the market in Pune, accounting for 31% of all transactions. Peripheral Business District (PBD) East has seen the largest share take-up of 45% of the total transactions in H1 2022, with Kharadi as the preferred location for occupiers in this micro-market. Secondary Business District (SBD) West followed by PBD East, saw a share take-up of 19% with Baner as the preferred location in this micro-market. The share of Central Business District (CBD) & Off CBD and SBD East has been 14% and 13% respectively.
From the aspect of office rents,Pune’s average office space rents escalated by 8% YoY in H1 2022 The rental moments were primarily driven by PBD East and SBD West micro-market, where the demand in H1 2022 was concentrated.
Paramvir Singh Paul, Branch Director – Pune, Knight Frank India said, “The city’s commercial market has witnessed strong revival recording high transactions during the first half of the year making it the third largest market for the first time since H2 2018With “back to office” becoming the new normal and office occupancies increasing, tenants are aligning their business plans accordingly for new space take up. Developers remain prepared by adding new supply, H1 2022 recorded highest half yearly supply added since 2012.
Business district wise transactions split in H1 2021 and H1 2022