The Four Outperforming Stocks to Add to Your Watchlist

Author – Brijesh Bhatia (@bbrijesh9)
Pune, 25 february 2025: Stock trading is a dynamic and highly unpredictable venture, where understanding the broader market context and the individual behaviour of stocks is crucial for success. As any seasoned trader will attest, during bullish markets, the majority of stocks tend to rise together, creating a generally positive environment for traders. However, when the market turns bearish, the situation shifts dramatically. This is when skilled stock picking truly shines. Knowing how to identify outperforming and underperforming stocks becomes a valuable skill, especially during periods of market downturns.
To understand the stocks that are positioned well to thrive even during challenging times, traders must develop methods to assess how individual stocks perform relative to the broader market or benchmark indices. One powerful tool to help achieve this is the Ratio Chart.
What is a Ratio Chart?
A Ratio Chart is a technical analysis tool used to compare the performance of a specific stock, asset, or sector against a benchmark index. This ratio is typically calculated by dividing the stock price by the price of the benchmark index, such as the Reliance/Nifty50.
The core idea is to visualise how a stock performs in relation to the overall market or a broader index. By analysing this relationship, traders can identify whether a stock is outperforming or underperforming in a particular time frame.
Interpretation of Ratio Movements:
- Rising Ratio: A rising ratio indicates that the stock is outpacing the index, meaning the stock is gaining more than the broader market.
- Falling Ratio: A falling ratio suggests that the stock is underperforming relative to the index, meaning it is losing more ground than the market as a whole.
- Flat Ratio: If the ratio stays flat, it implies that the stock is moving in sync with the benchmark index, neither outperforming nor underperforming.
Why Ratio Charts are Important for Traders:
In downward-trending markets, selecting stocks that can perform better than the index is important. Ratio charts help traders quickly identify those stocks that have been outperforming their benchmarks, even when the broader market is bearish. By focusing on these outperformers, traders increase the likelihood of success, as these stocks have a proven track record of relative strength.
As we want the medium-term trend, we are analysing the weekly chart trend of the stock and index using the scanner.
Using Definedge’s RZone Scanner to Identify Outperforming Stocks
One powerful tool available to traders looking to spot outperformers is RZone by Definedge. This Top-Down Approach scanner scans the markets for stocks showing relative strength compared to the Nifty50. The scanner runs a comprehensive analysis to identify stocks outperforming the index on multiple technical fronts, including their price movements, momentum, and trend consistency.
After running the RZone scanner on the constituents of the Nifty50 and comparing them with the Nifty50 index itself, the following four stocks have emerged as outperformers in the medium term:
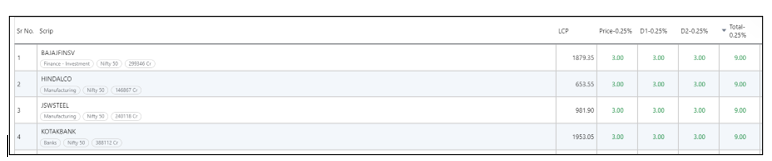
Source: RZone, Definedge Securities
Conclusion
Stock picking is a critical skill for traders, particularly in bearish or uncertain market conditions. Ratio charts provide an invaluable tool for evaluating how a stock performs in relation to a broader market index, helping to identify outperformers that may present strong buying opportunities. By analysing ratio charts on a weekly timeframe, traders can identify stocks with consistent outperformance, offering a higher probability of success. Short-term traders can scan the daily timeframe, too.
Tools like RZone by Definedge take this process a step further by automating the identification of outperformers. With proper analysis and vigilance, traders can use ratio charts to effectively navigate bullish and bearish markets, selecting the stocks most likely to continue their upward trend.
Disclaimer: The purpose of this article is only to share interesting charts, data points and thought-provoking opinions. It is NOT a recommendation. This article is strictly for educative purposes only.
As per SEBI guidelines, the writer and his dependents may or may not hold the stocks/commodities/cryptos/any other assets discussed here. However, clients of Definedge may or may not own these securities.
About Writer:
Brijesh Bhatia has over 18 years of experience as a trader and technical analyst in India’s financial markets. He is a well-known face in the business channel as a Market Expert and has worked with broking giants like UTI, Asit C Mehta, and Edelweiss Securities. He is currently a Senior Research Analyst and Editor at Definedge.