The Outperforming Stocks for the Upcoming Week Are…
Author – Brijesh Bhatia (@bbrijesh9)
Pune, 25 January 2025: Identifying stocks that are poised to outperform the market is crucial for developing a profitable trading strategy while trading in stock markets. The Ratio Chart and Relative Strength Matrix are two powerful tools that can significantly aid traders in this process. Using an objective method like Point & Figure charting helps traders systematically identify outperforming and underperforming stocks based on price action and relative strength.
Ratio Chart
The Ratio Chart is a visual representation of the relative performance of one instrument against another, typically a benchmark like the Nifty50 index. This chart is plotted as a ratio of the price of a stock to the price of the benchmark index over a specific period. The key idea behind the Ratio Chart is to identify stocks that are outperforming (bullish trend) or underperforming (bearish trend) relative to the market or an index.
How does the Ratio Chart work?
- A rising ratio indicates that the stock (numerator) is outperforming the benchmark index (denominator).
- A falling ratio means the stock (numerator) is underperforming relative to the benchmark (denominator).
- This method allows traders to easily spot stocks that are showing relative strength compared to the broader market.
In terms of trading, a bullish pattern on the Ratio Chart indicates that a stock is expected to continue its outperformance, while a bearish pattern suggests the stock might lag the market.
Relative Strength Matrix
The Relative Strength Matrix is a tool that groups stocks based on their relative performance compared to a benchmark or against each other. It presents a grid where stocks are plotted according to their relative strength (RS) values. The matrix visually categorises stocks into different performance groups—outperformers, underperformers, and those in a neutral zone.
Traders often use the Relative Strength Matrix to prioritise stocks for their portfolio based on the relative strength score, making it easier to identify where the greatest potential for profit lies.
Objective Method: Point & Figure Charting
Point-and-figure (P&F) charting is an objective technical analysis method that focuses on price movements, filtering out the noise. P&F charts plot price changes as Xs (for upward movements) and Os (for downward movements) in a grid-like format.
Using P&F charts to analyse the Ratio Chart or Relative Strength Matrix effectively confirms trends and patterns. Here’s how the P&F method can be applied:
- Bullish patterns on the Ratio Chart indicate that the stock has a strong potential for growth relative to the benchmark.
- Bearish patterns suggest underperformance and potential for decline.
By combining P&F charting with Ratio Charts and the Relative Strength Matrix, traders can objectively shortlist stocks that are likely to outperform or underperform the market.
Scanner in the RZone
Thanks to the RZone scanner, traders can quickly scan for stocks that exhibit bullish or bearish patterns on the Ratio Chart. With just a few clicks, you can scan through a list of stocks and get results in minutes, enabling you to identify the top performers and weakest stocks based on their relative strength.
Scanning stocks in a few minutes is an invaluable tool for traders who must stay ahead of market trends and find the best opportunities without excessive manual analysis.
Here is the list of the Nifty50 constituents forming a bullish pattern on the ratio chart of Stock/Nifty50.
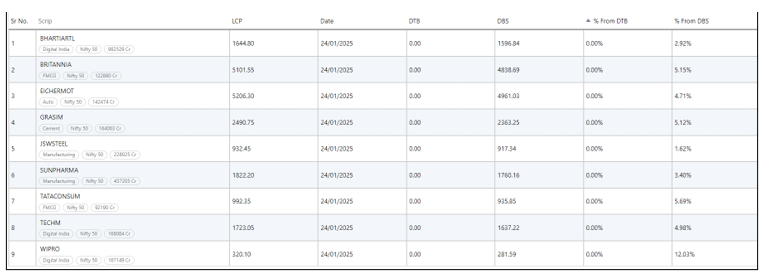
Source: RZone, Definedge Securities
The Trader’s Nest by Definedge
If you are eager to learn more about Ratio Charts, Relative Strength Matrices, and other advanced technical analysis tools, Definedge is launching Online Trader’s Nest. This platform is designed for stock market enthusiasts who want to deepen their understanding of these techniques and gain hands-on experience applying them.
Trader’s Nest will offer:
- Comprehensive lessons on Point & Figure, Options Trading and Relative Strength Analysis.
- Access to advanced scanning tools like the RZone scanner.
- Insights into the latest market trends and how to capitalise on them.
If you are interested in learning more, be sure to check out the details and sign up for updates on the upcoming Online Trader’s Nest from Definedge!
Disclaimer: The purpose of this article is only to share interesting charts, data points and thought-provoking opinions. It is NOT a recommendation. This article is strictly for educative purposes only.
As per SEBI guidelines, the writer and his dependents may or may not hold the stocks/commodities/cryptos/any other assets discussed here. However, clients of Definedge may or may not own these securities.
About Writer:
Brijesh Bhatia has over 18 years of experience as a trader and technical analyst in India’s financial markets. He is a well-known face in the business channel as a Market Expert and has worked with broking giants like UTI, Asit C Mehta, and Edelweiss Securities. He is currently a Senior Research Analyst and Editor at Definedge.