King Oscillator Flags Demand Zone for RELIANCE INDUSTRIES
Pune, 22 November 2024: The Indian stock market has been under significant pressure recently, with benchmark indices falling by more than 10% from their highs. As the market continues to face downward pressure, the readers are shifting their focus to technical analysis, hoping to identify support zones where a reversal might occur.
In this article, we will explore Reliance Industries in detail, utilising technical analysis to assess its current positioning and potential for a reversal, offering insights for our readers.
Reliance Industries: On the Verge of a Multi-Year Support Zone
Reliance Industries, one of India’s largest and most influential conglomerates, is trading just a few percentage points above its 52-week low of ₹1,184.95 (adjusted for bonus issues). As the stock nears this critical support level, it’s crucial to understand the technical setup and the significance of these price levels.
In technical analysis, the 200 Exponential Moving Average (EMA) is one of the most widely used indicators to determine a stock’s long-term trend. The 200 EMA acts as a dynamic support or resistance zone, providing traders with valuable insights into whether a stock is in an uptrend or downtrend.
Reliance Weekly Chart
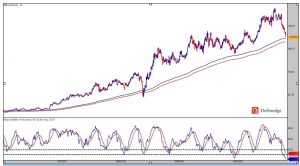
Source: TradePoint, Definedge Securities
Looking at the price history since 2016, the channel formed by the 200EMA (High) and 200EMA (Low) has acted as a consistent support zone for Reliance. This has been a place where the stock has seen prolonged periods of accumulation, indicating a significant level of investor interest. During the pandemic in 2020, Reliance breached this channel briefly, but the price quickly reversed, confirming the significance of this support zone.
Currently, Reliance is approaching this demand zone again, with the stock trading near the ₹1,150-1,200 band. The current price of around ₹1,223 is just a few percentage points away from this historical support level. The closer the stock price gets to this zone, the higher the chances of a potential reversal.
Are you convinced to accumulate this stock?
If not yet, then look at this oscillator.
The King Oscillator: A Unique Indicator to Confirm the Trend
While chart patterns and moving averages offer valuable insights, technical analysis is incomplete without a proper momentum indicator. Over time, traders tend to use various oscillators to measure a trend’s strength. However, to keep things simple, I have utilised The King Oscillator—a custom indicator designed by Definedge using nine different indicators available only in Definedge TradePoint and RZone. This powerful tool helps identify potential reversal points by tracking overbought and oversold conditions.
The King Oscillator is particularly useful when it falls into the 30-40 zone, which typically precedes a reversal when the price is above the 200-Week EMA channel. The King Oscillator is currently reading at 22, indicating that the stock is in an oversold condition and could be on the verge of a reversal. However, it’s important to wait for a confirmation. A bullish crossover in the oscillator would signal a probable reversal.
The Path to Reversal
Though the technical indicators suggest that Reliance is approaching a key support zone, it’s important to emphasise that confirmation is key. The King Oscillator is at a level where reversals have occurred in the past, but traders should wait for a bullish crossover before taking any decisive action. The failure to confirm the reversal could lead to further downside risk, so patience is required.
If the price confirms the reversal and starts trending upwards, Reliance could once again become an attractive stock for accumulation. This would benefit individual investors and have a positive impact on the broader market. As Reliance carries significant weight in the Nifty50 index, a rebound in its stock price could be the catalyst needed for the Nifty50 to resume its upward trajectory or at least slowdown the pace of decline in the index.
The Sentiment vs. Chart Signals: Contrasting Views
It’s essential to recognise the psychological aspect of investing during times of market uncertainty. When a stock like Reliance nears its 52-week low, there’s often a negative sentiment in the market, leading many investors to shy away, fearing further losses. However, technical analysis tells a different story, showing a stock approaching a historically strong support zone with oversold conditions that suggest a potential reversal.
While the sentiment may be bearish, the chart signals could offer an opportunity for those willing to take a contrarian stance. It’s not uncommon for the market to overreact, especially when driven by fear and uncertainty, but technical indicators can often uncover hidden opportunities.
A Potential Turning Point for Reliance Industries
In conclusion, the technical setup for Reliance Industries suggests that the stock is nearing a key support level around the ₹1,150-1,200 range. The customised 200-EMA channel and the King Oscillator indicate that the stock could be on the verge of a reversal. While the sentiment remains negative due to the recent price declines, readers should be looking for confirmation of a bullish reversal.
Disclaimer: The purpose of this article is only to share interesting charts, data points and thought-provoking opinions. It is NOT a recommendation. This article is strictly for educative purposes only.
As per SEBI guidelines, the writer and his dependents may or may not hold the stocks/commodities/cryptos/any other assets discussed here. However, clients of Definedge may or may not own these securities.
About Writer:
Name: Brijesh Bhatia
Twitter Handle: @bbrijesh9
Bio: Brijesh Bhatia has over 18 years of experience as a trader and technical analyst in India’s financial markets. He is a well-known face in the business channel as a Market Expert and has worked with broking giants like UTI, Asit C Mehta, and Edelweiss Securities. He is currently a Senior Research Analyst and Editor at Definedge.