Is Nifty Still Bullish? A System-Based Look Beyond the Headlines
Pune, 08 May 2025: The markets, like mountains, are often still until stirred by wind, by weather, or by war. In the wake of the Pahalgam attack, a gust of uncertainty swept acrossnthe trading community. Whispers of war echoed through terminals and trading floors, and suddenly, the charts were forgotten. Just as traders were being comforted after the tariff volatility, another fear took the wheel, and facts were left behind.
But markets, as history has shown time and again, care little for fear. They respond to data, to patterns, to the undeniable rhythm of price and volume. At Definedge, we have built our compass not on emotion but on a system-driven approach. When the crowd trembles, we turn to the charts. When noise crescendos, we listen to signals.
While many stayed on the sidelines, paralysed by the geopolitical tremors, the Nifty50 was quietly telling a different story.
Nifty50 Point & Figure Chart
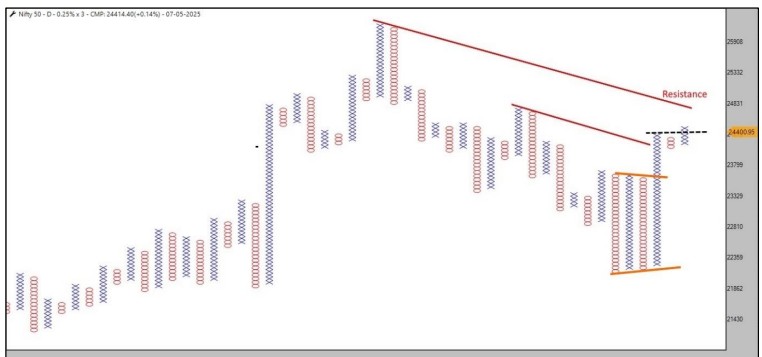
On the 0.25% x 3 P&F chart, a four-column triangle breakout emerged on the north, indicating the end of the consolidation zone and the beginning of the new
trend. More importantly, it came with an Anchor Column Follow Through (AFT)— a confirmation of conviction.
Yes, there’s some resistance lingering at the 45-degree trendline. The breakout will mark a shift from fear to fact, from retreat to advance.
Nifty50 Heikin Ashi Weekly Chart
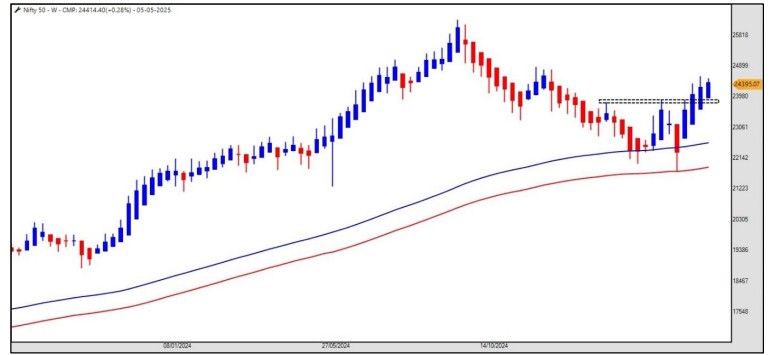
Zooming out to the weekly Heikin Ashi chart, the Nifty made a stand near the 200-week EMA channel—a line in the sand for many long-term watchers. The
chart lit up with bullish candles, pushing past a long-held resistance zone. In a world panicking over headlines, the Nifty wrote its own, with price action.
RSI: Momentum Has a Message
Enter the RSI Indicator Digger, a tool that cuts through the clutter. The latest scan? 41 of the 50 Nifty stocks show positive weekly RSI trends.
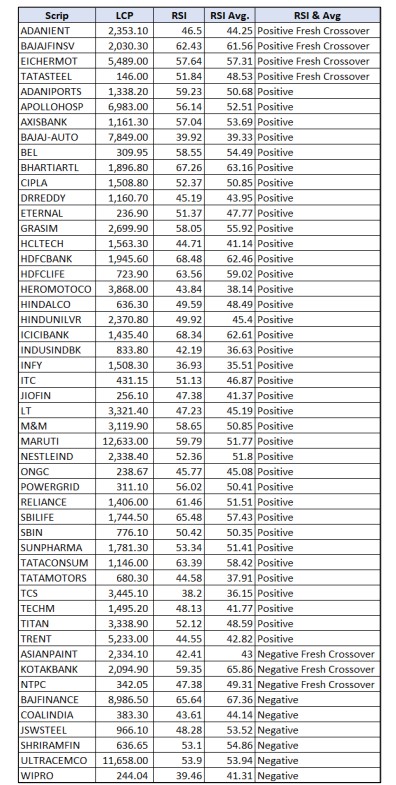
That’s not a whisper—it’s a roar from the bulls. The message: momentum is not just intact, it’s accelerating.
Stay Grounded, Not Guarded
It’s easy to be swept up in a sea of speculation. The market thrives on emotion, but it rewards discipline. At Definedge, we don’t predict—we prepare.
Yes, every trend has its limits. 24,000 on the Nifty is our line in the sand. A close below that, and we reassess. Until then, the data points north.
In times of fear, most look away. But those who look closer see the truth unfold— one chart, one candle, one signal at a time. At Definedge, we will keep listening
to the markets.
Because the charts always speak—loudest when no one else is listening.
Disclaimer: The purpose of this article is only to share interesting charts, data points and thought-provoking opinions. It is NOT a recommendation. This article
is strictly for educative purposes only.
As per SEBI guidelines, the writer and his dependents may or may not hold the stocks/commodities/cryptos/any other assets discussed here. However, clients
of Definedge may or may not own these securities.