What’s Next for Nifty50 and Nifty 500?

Author: Brijesh Bhatia (@bbrijesh9)
Pune, 26 March 2025: The market’s recent rally from 22,000 to 23,800 in the Nifty50 index has brought a spark of optimism back to Dalal Street. Many stocks have witnessed impressive rebounds, soaring by 10-20% from their lows. But let’s not get carried away just yet. These gains are largely a bounce after many stocks corrected by 30-50% from their peak levels.
Is it a true recovery? Well, it’s still too early to tell.
What’s really causing some concern is that a staggering 70% of the Nifty50 stocks are still trading below their 200-day moving average (200DMA). A deeper dive into the broader indices reveals that the situation isn’t any better with 78% of stocks in the Nifty 200 and 80% of stocks in the Nifty 500 are also languishing below their 200-day moving average.
But why does the 200DMA matter so much? To put it simply, the 200DMA serves as a critical benchmark for identifying the long-term trend of a stock or index. If a stock or index is trading above its previous level, it is typically seen as being in a bullish phase, while trading below suggests a bearish or corrective phase. In other words, the fact that many stocks remain below this threshold suggests that the broader market hasn’t yet fully regained its strength.
Does the Chart Support the Bearish Trend?
Let’s take a look at the charts for the Nifty50 and Nifty500 to see if they back up the idea of a bearish trend.
Nifty50 Daily Chart
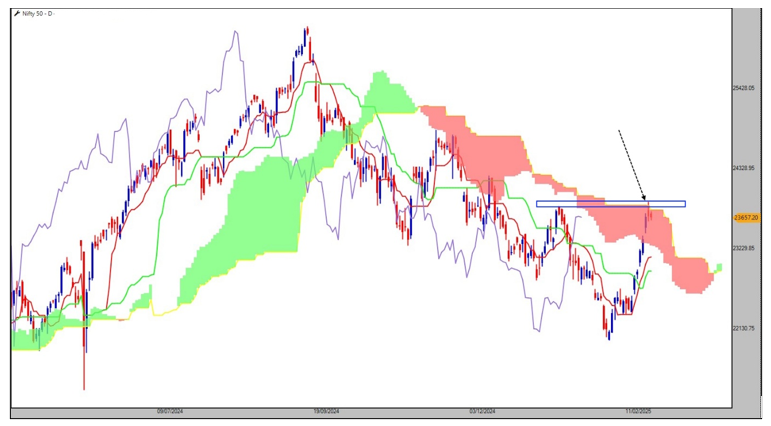
Source: TradePoint, Definedge Securities
On the daily chart of Nifty50, there’s a clear resistance zone forming around the 23,800-23,850 level, which coincides with the previous swing high and the Ichimoku cloud. The Ichimoku, a popular technical analysis tool, is often seen as a key level for both support and resistance. Right now, it’s acting as a significant barrier, halting the market’s bullish momentum.
So, is this a simple pause before the rally picks up again? Or is this the beginning of a larger reversal? Well, the answer will depend on how Nifty50 reacts to the next hurdle — 24,330. If the index can convincingly push above this level, the rally may continue. But until then, the jury is still out.
Nifty500 Daily Chart
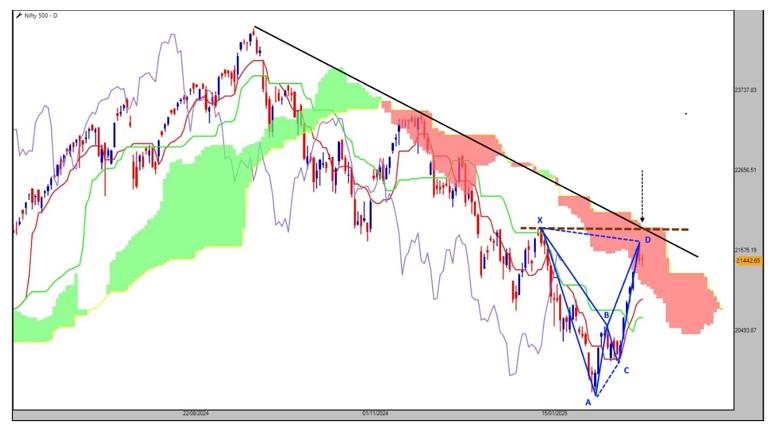
Source: TradePoint, Definedge Securities
The Nifty 500 index is following a similar pattern to the Nifty 50, with resistance being met at the Ichimoku cloud. However, there’s a twist here.
A Bearish Harmonic reversal pattern is emerging in the Nifty 500 chart, accompanied by a falling trendline at approximately the same level. This double whammy of resistance suggests that the upside potential could be limited, and the index might be poised for a pullback. The risk of a downside move is higher here, as these technical patterns often signal the reversal of a rally.
Stay Flexible, Stay Smart
Trends can change in the blink of an eye, and a rigid mindset can cost traders big time. It’s crucial to be adaptable, stay alert to evolving market conditions, and be ready to seize opportunities when they arise.
And remember, in this game, there’s no such thing as a bad score as long as you are booking profits. Missing the next rally is part of the journey. The goal is to ride the trends, make calculated moves, and walk away with profits — not necessarily to catch every single move in the market.
Will we see new highs, or will the bears make their comeback? Time and the charts will tell.
Disclaimer: The purpose of this article is only to share interesting charts, data points and thought-provoking opinions. It is NOT a recommendation. This article is strictly for educative purposes only.
As per SEBI guidelines, the writer and his dependents may or may not hold the stocks/commodities/cryptos/any other assets discussed here. However, clients of Definedge may or may not own these securities.
About Writer:
Brijesh Bhatia has over 18 years of experience as a trader and technical analyst in India’s financial markets. He is a well-known face in the business channel as a Market Expert and has worked with broking giants like UTI, Asit C Mehta, and Edelweiss Securities. He is currently a Senior Research Analyst and Editor at Definedge.