Can Nifty50 Repeat Its History?

Author – Brijesh Bhatia (@bbrijesh9)
Pune, 15 February 2025: Financial markets are often thought to be unpredictable, yet they exhibit recurring patterns over different time frames. One of the most intriguing concepts in technical analysis is fractals, which suggest that market movements are self-similar across various scales. Mathematician Benoît Mandelbrot popularised this idea, frequently observed in price charts, where historical market structures appear to repeat in different market cycles.
Understanding Fractals in Stock Market Analysis
Fractals are price patterns that occur in different time frames, ranging from intraday charts to long-term trends. They indicate repetitive cycles of market behaviour influenced by investor psychology, economic events, and liquidity flows.
In technical analysis, fractals are used to:
- Identify support and resistance levels
- Recognize trend reversals
- Confirm the validity of a market structure over different time frames
The Nifty50 Fractal: 2008-2016 vs. 2020-2025
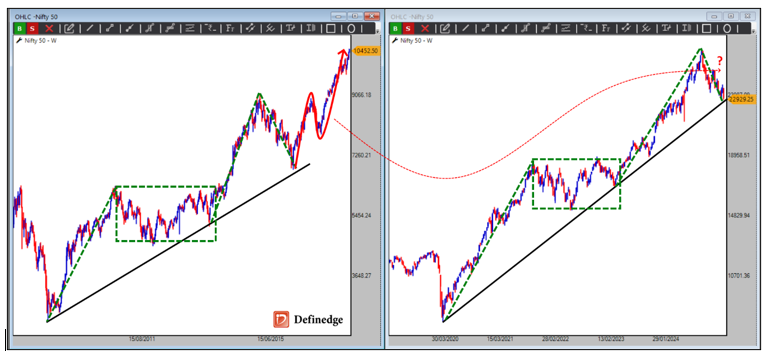
Historical patterns provide valuable insights into potential future price movements. A compelling case of fractal behaviour can be observed in the Nifty50 index, comparing the market movements from 2008-2016 and 2020-2025.
2008 Market Crash and Recovery (2008-2016)
- The global financial crisis led to a sharp correction in stock markets worldwide.
- The Nifty50 index hit a low of 2,252 in 2008, marking a significant bottom in extreme market fear.
- A rising trendline connecting the 2008 low acted as a critical support level.
- In 2016, the index again found support at this trendline at 6,825, leading to a rally that took Nifty50 to 11,760 over the next two years.
2020 Market Crash and Recovery (2020-2025)
- The COVID-19 pandemic triggered another sharp market decline, bringing Nifty50 down to 7,511 in March 2020.
- A new rising trendline from the 2020 low is now acting as a significant support level.
- In 2024-2025, this trendline aligns around 22,650, which bears a striking resemblance to the support level seen in 2016.
- The index is currently hovering around the 62-Week Exponential Moving Average (62WEMA) channel, which previously signaled a potential market reversal.
Why Fractals Matter for Traders and Investors
- Identifying Recurring Market Cycles
- Fractals help traders recognise familiar price structures and anticipate future movements.
- If the 2020-2025 cycle follows the 2008-2016 cycle, a significant rally could be in store from current levels.
- Enhancing Trend Analysis
- The rising trendline from major bottoms serves as a key support level, providing a reference point for traders.
- The Nifty50’s reaction at 22,650 could signal the next medium-term bottom, similar to how 6,825 did in 2016.
- Confirming Price Action with Moving Averages
- The 62WEMA channel has historically provided strong support.
- If Nifty50 holds at this level and reverses may indicate another upward phase, reinforcing the fractal pattern.
Fractals and Market Psychology
Market behaviour is primarily influenced by investor sentiment, and fractals reflect this cyclic nature:
- Panic Selling and Capitulation: Seen in 2008 and 2020 when investors exited en masse.
- Recovery: The recovery observed in 2008-2010 and the resumption of the rally excited institutions buying. Can it repeat in 2025 as Foreign Institutional Investors (FII) have been selling aggressively?
- Momentum and Euphoria: Following recovery, markets typically enter a bullish phase, as seen in 2017-2018 and potentially post-2025.
The Power of Fractals in Market Forecasting
Fractals provide a unique perspective on technical analysis, allowing traders to recognise historical patterns and apply them to current market conditions. The Nifty50’s 2008-2016 and 2020-2025 structure highlights how markets often repeat themselves in different time frames. If the fractal holds true, Nifty50 may potentially witness a strong rally from the 22,500-23,000 zone, just as it did after finding support at 6,825 in 2016.
While history may not always repeat itself exactly, it often rhymes, providing a valuable roadmap for market participants.
Disclaimer: The purpose of this article is only to share interesting charts, data points and thought-provoking opinions. It is NOT a recommendation. This article is strictly for educative purposes only.
As per SEBI guidelines, the writer and his dependents may or may not hold the stocks/commodities/cryptos/any other assets discussed here. However, clients of Definedge may or may not own these securities.
About Writer:
Brijesh Bhatia has over 18 years of experience as a trader and technical analyst in India’s financial markets. He is a well-known face in the business channel as a Market Expert and has worked with broking giants like UTI, Asit C Mehta, and Edelweiss Securities. He is currently a Senior Research Analyst and Editor at Definedge.