Choppy Waters or Clear Skies? The Indian Stock Market’s Next Move

By Brijesh Bhatia (@bbrijesh9)
Pune, 19th January 2025: The Indian stock market is in a fearful state of sentiment as the benchmark index Nifty50 hits a six-month low. But how long do sentiments drive the markets?
Last week, momentum witnessed the tug-of-war between bulls and bears, which recently formed the long-legged Doji candlestick pattern on the weekly chart after a breakdown below the previous low. This scenario is worth analysing closely, particularly when we consider accompanying signals like the Relative Strength Index (RSI) and various stock stats, which suggest a potential reversal in market sentiment.
Nifty Weekly Chart
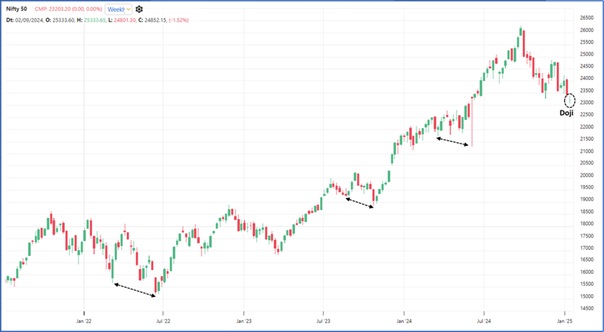
Source: Zone, Definedge Securities
In technical analysis, candlestick patterns are crucial in interpreting price action and forecasting possible market movements. The Long-Legged Doji is one such pattern that signifies indecision in the market. It forms when the opening and closing prices are bunched up close to each other, but the range between the high and low is extensive, resulting in long upper and lower shadows.
When this pattern appears after a sustained downtrend, it indicates that the market has reached a point of indecision, where neither the bulls nor the bears could dominate the price action. It often suggests a potential reversal or trend exhaustion, although confirmation is needed from subsequent price action.
In the current scenario, the formation of this long-legged doji on the weekly chart signals indecision in the market following a breakdown below the previous low. The key here is the confirmation. If the market crosses above the high of the last week (23,400), it would confirm a reversal, per the candlestick theory.
Interestingly, the bears lack the follow-up momentum after breaking the previous swing low, and the current candlestick pattern highlights that exhaustion may be another case of failure for bears.
Nifty50 Daily Chart
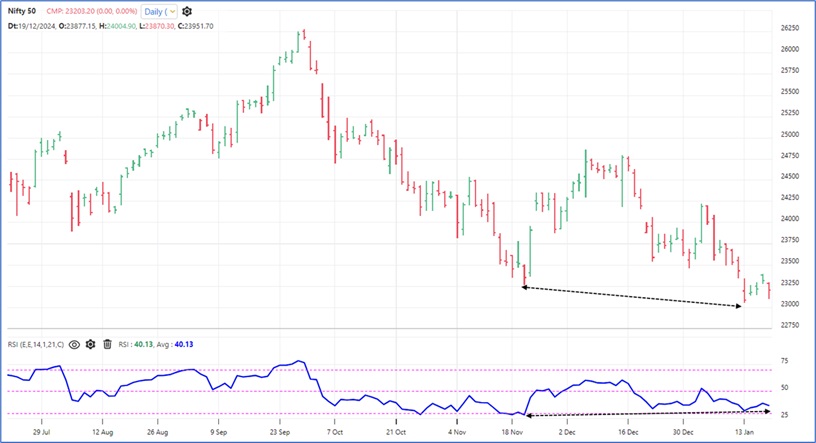
Source: Zone, Definedge Securities
One of the other interesting signals in this market analysis is the positive divergence observed on the Nifty50 daily chart. Positive divergence occurs when the price makes a new low, but the RSI forms a higher low, indicating that the momentum behind the price move is weakening.
In this case, the RSI has not confirmed the breakdown of the previous low in terms of momentum. This suggests that the current market weakness may lack the strength to sustain a prolonged downward trend, thus adding weight to the theory of an impending reversal.
If the Nifty50 fails to make a further lower low, or if the RSI starts to rise again, the market may be signalling a shift in sentiment toward a bullish phase.
RSI: A Key Technical Indicator for Market Reversal
The Relative Strength Index (RSI) is one of technical analysis’s most widely used momentum oscillators. Developed by J. Welles Wilder, the RSI helps identify whether an asset is overbought or oversold and can be used to spot potential reversal points. The RSI is measured on a scale of 0 to 100, with readings above 70 indicating overbought conditions and readings below 30 suggesting oversold conditions.
The RSI also helps identify divergence and convergence, indicating potential market reversals. Divergence occurs when the price of an asset moves in the opposite direction to the RSI, which may signal that the current price trend is weakening.
Understanding Positive and Negative RSI
The RSI can provide insight into the prevailing market strength by analysing whether it is moving in the positive or negative zone.
- Positive RSI: When the RSI is above 50, it suggests that buying pressure is dominant and the market is relatively bullish. An RSI above 60-70 is often considered a signal of overbought conditions, meaning the market may be due for a correction.
- Negative RSI: When the RSI is below 50, it indicates that selling pressure dominates the market and is in a bearish phase. An RSI below 30 is generally considered oversold, and some traders interpret this as a potential buying signal, as the market may be due for a bounce.
Crossover Theory: Positive vs. Negative
The concept of crossovers in the context of RSI provides traders with additional signals for potential trend reversals:
- Positive Crossover occurs when the RSI crosses a previously established threshold (such as crossing from below 30 to above 30 or from below 50 to above 50). A positive crossover typically signals increasing bullish momentum.
- Negative Crossover: Conversely, a negative crossover happens when the RSI crosses below an established threshold, indicating that bearish momentum is strengthening.
RSI Stats of Nifty500 Stocks
Using RZone, the analysis platform of Definedge, we scanned the RSI of the stock for the constituents of Nifty500; you will be surprised to look at the stats.
Around 60% of the stocks are currently in the positive zone, which indicates that a majority of the market is witnessing bullish momentum. Let’s break this down further:
- Positive Fresh Crossover (55 stocks): These stocks have recently seen a positive crossover, signalling fresh bullish momentum. They will likely be in an uptrend or confirm the reversal, suggesting potential strength in the broader market.
- Positive (241 stocks): These stocks are in the positive RSI zone and have a more moderate bullish stance across a significant portion of the market.
- Negative (161 stocks): These stocks are in the negative RSI zone, suggesting they are under selling pressure. However, the number of stocks in this category is not overwhelming, which means the overall market sentiment still leans toward the positive side.
- Negative Fresh Crossover (43 stocks): These stocks have recently seen a negative crossover, signalling a fresh bearish shift. Although this number is relatively small, it cannot be ignored, as it indicates that some stocks in the market are experiencing fresh selling pressure.
Are the Markets on the Cusp of Reversal?
Given the combination of signals from candlestick patterns and the RSI, there is a strong case for the Indian stock market potentially being on the cusp of a reversal. The long-legged doji pattern on the weekly chart, signalling indecision, suggests a possible end to the current downtrend.
Moreover, the fact that 60% of Nifty500 stocks are in the positive RSI zone and the positive divergence observed on the Nifty50 chart reinforces the notion that the current weakness may not have the strength to continue. If the broader market’s RSI continues to show strength and the Nifty50 crosses its recent highs, it could potentially confirm a market reversal.
Disclaimer: The purpose of this article is only to share interesting charts, data points and thought-provoking opinions. It is NOT a recommendation. This article is strictly for educative purposes only. As per SEBI guidelines, the writer and his dependents may or may not hold the stocks/ commodities/ cryptos/ any other assets discussed here. However, clients of Definedge may or may not own these securities.
(About Author: Brijesh Bhatia has over 18 years of experience as a trader and technical analyst in India’s financial markets. He is a well-known face in the business channel as a Market Expert and has worked with broking giants like UTI, Asit C Mehta, and Edelweiss Securities. He is currently a Senior Research Analyst and Editor at Definedge.)