Critical Pollution Hotspots Identified in Pune, Pimpri Chinchwad through Hyperlocal Monitoring
Pune, 6th December 2024: A report released on Friday revealed critical pollution hotspots in Pune and Pimpri-Chinchwad, with PM2.5 levels in some areas significantly exceeding the national safety standards. It highlights the need for precise, localised efforts to protect public health and improve urban air quality.
The report – Decoding Urban Air: Hyperlocal Insights into PM2.5 Pollution Across Indian Metropolises – by Respirer Living Sciences unveils the state of air quality presently outside the ambit of the Central Pollution Control Board (CPCB) ambient air quality monitoring network. The report includes location-specific average CPCB data for November 2024 across 10 Indian cities but goes a step further by integrating hyperlocal monitoring and analysis, providing granular insights into pollution hotspots that traditional systems may miss.
Leveraging hyperlocal data from over 150 sensors deployed across cities, Respirer combined air quality analysis from its AtlasAQ Platform using CPCB monitoring data and overlaid spatial insights from Google Maps Air Quality application programming interface (API). The report provides a 500×500 meter resolution of air quality trends. These innovative technologies revealed pollution patterns offering actionable insights for policymakers, urban planners, and citizens.
Google has partnered with Respirer on the AirView+ initiative to enhance air quality monitoring across India.
Key Findings for Pune and Pimpri-Chinchwad
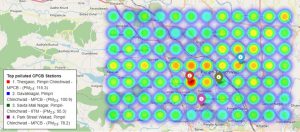
● Hotspots Identified in Pune: Revenue Colony (Shivajinagar), Hadapsar, and Transport Nagar-Nigdi emerged as critical pollution zones, with PM2.5 levels ranging between 60-100 µg/m³ in affected areas.
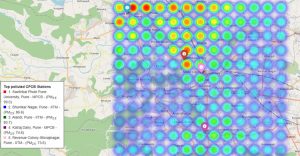
● Hotspots Identified in Pimpri-Chinchwad: Thergaon, Savta Mali Nagar, and Gavalinagar recorded PM2.5 levels crossing 115 µg/m³ in key industrial and urban zones.
● Factors Driving Pollution: Vehicular congestion, urban construction, and rapid industrialization were identified as major contributors to the pollution hotspots in both cities.
● Comparative Insights: While CPCB data provided an overall picture of pollution levels, hyperlocal monitoring revealed additional unmonitored hotspots and finer variations across urban and peri-urban areas.
The report outlines actionable recommendations to address urban air pollution, including implementing targeted emission controls and expanding low-emission zones; integrating urban forestry and green infrastructure to act as natural pollution buffers, and promoting public awareness through real-time data tools and educational campaigns.
“Hyperlocal air quality monitoring bridges the gap between traditional broad-scale assessments and the localised realities of air pollution. By providing fine-grained, real-time data, this approach enables us to pinpoint pollution sources with accuracy and design targeted interventions that can improve public health outcomes. It is commendable that organisations such as Respirer are leveraging innovative technologies such as advanced sensors and data analytics to address this urgent need, offering actionable insights towards pollution abatement,” said Professor Sachchida Nand Tripathi, Chair, Steering Committee, National Clean Air Programme (NCAP) and Dean, Kotak School of Sustainability, IIT
- Average PM2.5 Levels – CPCB data compilation for Pune
| Station | PM2.5 |
| Panchawati_Pashan Pune – IITM | 36.1 |
| Hadapsar Pune – IITM | 50.1 |
| Karve Road Pune – MPCB | 51.5 |
| Mhada Colony Pune – IITM | 58.4 |
| Transport Nagar-Nigdi Pune – IITM | 62.6 |
| Revenue Colony-Shivajinagar Pune – IITM | 73.6 |
| Katraj Dairy Pune – MPCB | 74.5 |
| Alandi Pune – IITM | 80.7 |
| Bhumkar Nagar Pune – IITM | 86.5 |
| Savitribai Phule Pune University Pune – MPCB | 99.0 |
- Average PM2.5 Levels – CPCB data compilation for Pimpri Chinchwad
| Station | PM2.5 |
| Park Street Wakad Pimpri Chinchwad – MPCB | 78.2 |
| Savta Mali Nagar Pimpri-Chinchwad – IITM | 95.2 |
| Gavalinagar Pimpri Chinchwad – MPCB | 100.8 |
| Thergaon Pimpri Chinchwad – MPCB | 115.2 |