Investing using the Multi-Timeframe RS Matrix
Author: Brijesh Bhatia (@bbrijesh9)
Pune, 11 December 2024: Investing in stocks often presents a dilemma for investors – should one focus on buying rising stocks or target those that are underperforming relative to benchmark indices? This debate has its roots in two widely used investment approaches – fundamental analysis and technical analysis.
In fundamental analysis, investors may gravitate toward value or growth stocks. Value investors often seek stocks trading below their intrinsic value, while growth investors look for companies poised for future growth, even if they are priced higher than their book value. Technical analysis, on the other hand, often involves strategies centred around price trends and momentum, with two common schools of thought:
Buying outperformers: This strategy focuses on stocks performing better than the market or a specific index (such as the Nifty50).
Selling underperformers: This approach targets stocks that are lagging behind their benchmarks and underperforming over a set period of time.
However, the concept of outperformers and underperformers is not so straightforward.
How do you define whether a stock is outperforming or underperforming? The answer is simple in theory – compare the stock to the benchmark index, in this case, the Nifty50. But the complexity arises when deciding over what time period to make that comparison—daily, weekly, monthly, or quarterly?
What if you could track a stock’s relative performance across multiple timeframes and better understand its trend?
Comparing each stock to the Nifty50 across several timeframes could seem overwhelming. Imagine tracking 50 stocks of Nifty50 constituents, each with four timeframes (quarterly, monthly, weekly, and daily), leading to the need to monitor 200 charts. Sounds tedious, right?
This situation, which might seem like a maze and reminds me of a line from the iconic song “Sar jo tera chakaraaye, Yaa dil duba jaaye, Aaja pyare paas hamaare Kaahe ghabaraay kaahe ghabaraay” by Mohd. Rafi.
Let me take this line seriously now – “Aaja pyare paas hamaare Kaahe ghabaraay kaahe ghabaraay.”
At Definedge, we have taken the hassle out of tracking the performance of multiple stocks against the Nifty50 by developing an advanced scanner that evaluates stock performance across multiple timeframes.
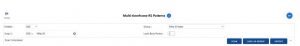
Source: RZONE, Definedge
The process involves using ratio charts, a powerful tool that compares a stock’s price movements against an index, such as the Nifty50. Ratio charts provide a clear visual of whether a stock is outperforming or underperforming an index by comparing its relative performance over time. Here’s how it works:
Quarterly Ratio Chart: Compares the stock’s price to the Nifty50 on a quarterly basis.
Monthly Ratio Chart: Measures the stock’s performance relative to the Nifty50 over the past month.
Weekly Ratio Chart: Tracks the stock’s performance over the previous week.
Daily Ratio Chart: Compares daily price movements with the Nifty50.
The Definedge scanner scores each stock’s relative performance against the Nifty50 for each timeframe. A score of 1 indicates that the stock is outperforming the Nifty50 in that timeframe, while a score of 0 suggests underperformance. Stocks that score 4 (outperforming on all four timeframes) are considered the most bullish, while stocks that score 0 are seen as bearish.
This ratio-based approach lets readers quickly identify the market’s strongest performers without manually checking every chart.
The Outperforming Watchlist
Using the scanner, we identified three stocks from the Nifty50 that are outperforming the index across all four timeframes (Quarterly, Monthly, Weekly, and Daily). Let’s take a closer look at these stocks:
1. HCL Technologies (HCL Tech)
HCL Technologies is a prominent player in the global IT services sector and is known for its cutting-edge software development, infrastructure management, and business process outsourcing solutions. The company has consistently demonstrated strong financial performance and a robust pipeline of technology innovations, making it a favourite among investors.
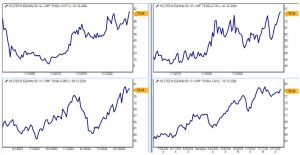
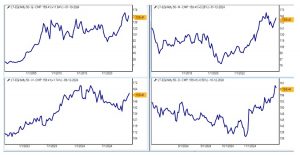
HCLTECH/NIFTY50 Ratio Chart
HCL Tech has shown resilience across all four timeframes on the ratio charts, outperforming the Nifty50 in both short-term and long-term views. Its steady growth in the IT services space, strong client relationships, and global expansion strategy continue to drive investor confidence. As a result, HCL Tech’s relative strength against the Nifty50 indicates a positive trend that readers can take advantage of.
2. Mahindra & Mahindra (M&M)
Mahindra & Mahindra (M&M) is one of India’s largest conglomerates, with a strong presence in sectors like automobiles, aerospace, agribusiness, and information technology. The company is especially well-known for its utility vehicles and tractor business, which have seen consistent domestic and international demand.
M&M/NIFTY50 Ratio Chart
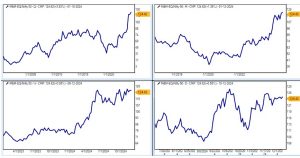
On the ratio charts, M&M shows impressive relative performance against the Nifty50. The company’s robust growth in the automotive and farm equipment segments and its global expansion initiatives continue to provide positive momentum for its stock.
3. Larsen & Toubro (L&T)
Larsen & Toubro (L&T) is a leading multinational in engineering, construction, and technology services. The company has a strong presence in the infrastructure and power sectors, making it a key player in India’s economic development.
L&T’s stock market performance has been strong, and the company has benefited from the ongoing infrastructure boom in India.
L&T/NIFTY50 Ratio Chart
The ratio charts for L&T indicate consistent outperformance across all timeframes, making it a reliable choice for readers.
To conclude, readers can quickly identify stocks like HCL Tech, M&M, and L&T using ratio charts and advanced scanners, which consistently outperform the Nifty50 across multiple timeframes. This multi-timeframe approach offers a comprehensive view of a stock’s performance and helps readers make informed decisions based on short-term and long-term trends.
Disclaimer: The purpose of this article is only to share interesting charts, data points and thought-provoking opinions. It is NOT a recommendation. This article is strictly for educative purposes only.
As per SEBI guidelines, the writer and his dependents may or may not hold the stocks/commodities/cryptos/any other assets discussed here. However, clients of Definedge may or may not own these securities.
About Writer:
Brijesh Bhatia has over 18 years of experience as a trader and technical analyst in India’s financial markets. He is a well-known face in the business channel as a Market Expert and has worked with broking giants like UTI, Asit C Mehta, and Edelweiss Securities. He is currently a Senior Research Analyst and Editor at Definedge.