Nifty Pharma 2: The Rule

By Brijesh Bhatia (@bbrijesh9/X)
Pune, 21st December 2024: It’s been three years since Pushpa: The Rise set the box office on fire with its record-breaking performance, and now, with the release of Pushpa 2: The Rule in December 2024, it stormed past a whopping Rs. 1,000 crores in earnings in just two weeks of its release.
But why are we discussing this in a stock market article?
Stick with us because we have uncovered a fascinating parallel in trading that could be the next big breakout story: Nifty Pharma.
As we analysed the performance of various sectors that could outperform the benchmark index Nifty50, one sector stood out which is Nifty Pharma. After a period of relative dormancy, Nifty Pharma is now breaking out on the ratio chart.
Could this sector rule mimic Pushpa’s blockbuster trajectory? We believe so, and here’s why.
The Ultimate Relative Strength Matrix: Our Secret Weapon
Before diving into the ratio charts, let us first explain the methodology behind our sector selection process. We are using the Ultimate Relative Strength (RS) Matrix based on point-and-figure (P&F) charts, an innovative method developed by Definedge for identifying strong market performers.
The Ultimate P&F-RS Matrix compares the performance of each sector/stock in a given group against its peers. A score of 1 is assigned when a stock shows bullish performance relative to its peers, and a score of 0 signifies bearish behaviour. The stock with the highest total score outperforms the majority of its peers.
What makes this approach so effective? The P&F charting method removes the noise and clearly visualises the sector’s strength. As of December 20, 2024, the results are nothing short of exciting.
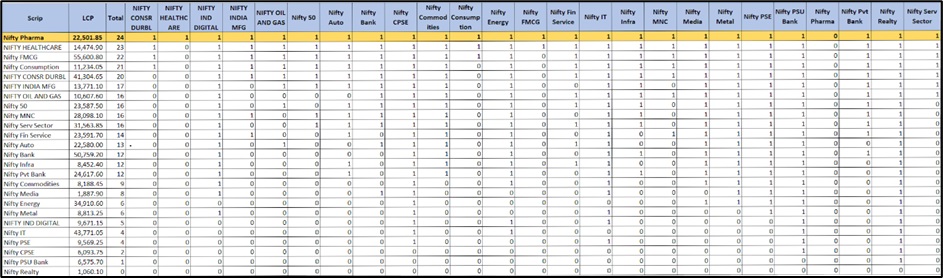
Source: RZone, Definedge Securities
Nifty Pharma has emerged with the highest score in a sector that has been showing signs of a breakout.
The Nifty Pharma Breakout: A Rising Star
The real story lies in the Nifty Pharma/Nifty50 ratio chart. The 0.25% X 3 Daily ratio chart shows a strong breakout from 2021 levels, signalling that Pharmaceutical stocks are likely to outperform the broader market.
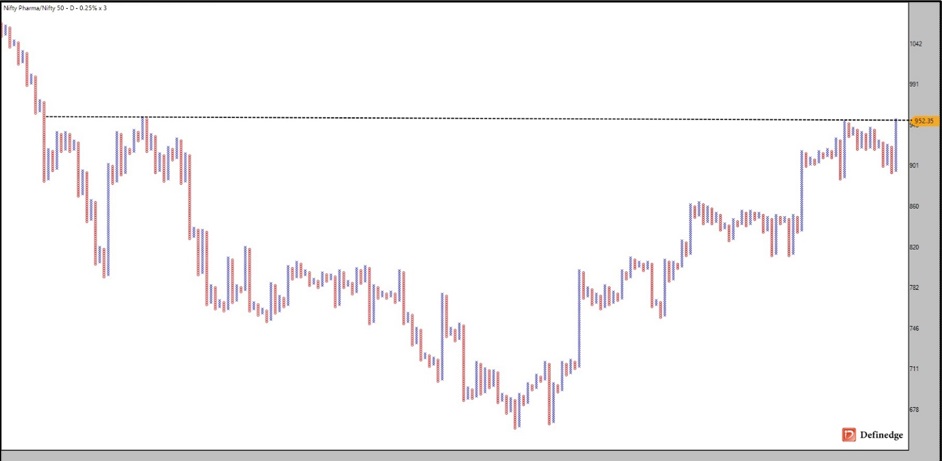
Source: TradePoint, Definedge Securities
This is a critical signal—when a sector starts outperforming the index after years of sideways action, it indicates a potential for substantial growth. The anchor column on the ratio chart reinforces this view, suggesting that the rise of Nifty Pharma is just beginning. We can almost hear the echo of Pushpa’s famous line, “Jukega Nahi”.
Who Will Lead Nifty Pharma?
Now, the big question: Which stocks in Nifty Pharma will lead the charge?
This is where we turn to the second step of our analysis—identifying the stocks poised for a rise. We ran the Ultimate P&F-RS Matrix scanner on the constituents of the Nifty Pharma index.
Nifty Pharma consists of 20 stocks, so the stock with a maximum score of 19 can be the potential leader. Based on the scanner results, we found some standout performers. Dr Reddy’s Laboratories (Drreddy) leads the pack with a perfect score of 19 points, followed by Ipca Labs (17 points), Divis Labs, and Lupin, each with 16 points.
Let us take a closer look at Dr. Reddy, the potential ruling leader in this sector.
Dr. Reddy’s: Ready for a Bullish Surge
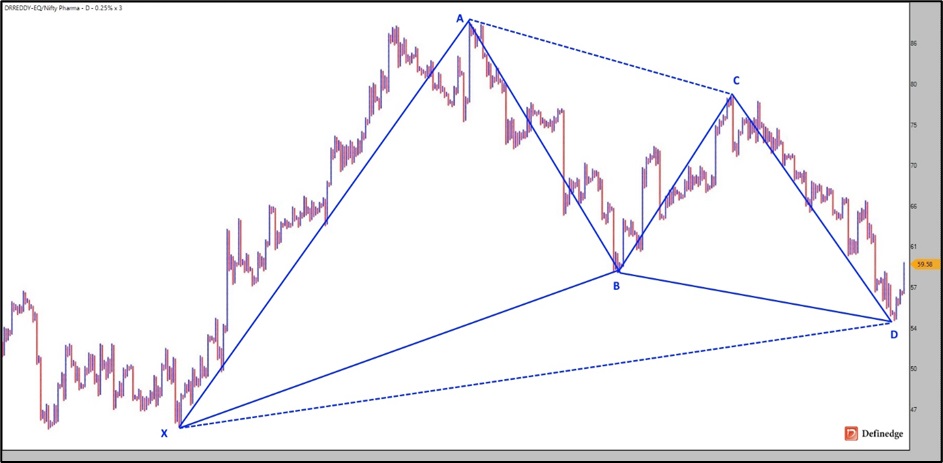
Source: TradePoint, Definedge Securities
Dr Reddy’s shows a Bullish Gartley harmonic pattern on the 0.25% X 3 Daily P&F ratio chart. This pattern is a technical indicator that often signals the end of a period of underperformance and the start of a new bullish trend.
For those unfamiliar with harmonic patterns, they are chart formations that are calculated using Fibonacci ratios. The Gartley pattern, in particular, is a reliable sign of reversal—marking the transition from a downtrend to an uptrend. If you want to learn about Harmonic patterns, we have a recorded course in our Gurukul platform.
Given Dr. Reddy’s top performance in the scanner, we are bullish on this stock. But that’s not all. Also keep an eye on Ipca Labs, Divis Labs, and Lupin, which are showing solid potential for growth and could join the rally.
The Bottom Line
In trading, timing is everything. Just as Pushpa took the world by storm, the Nifty Pharma sector is primed for a similar rise and rule, with the potential to outshine the benchmark Nifty50 index. The Ultimate P&F-RS Matrix has identified the top performers in this sector, with Dr Reddy leading the charge.
So, as you prepare your portfolio for the coming year, consider adding these pharma stocks to your watchlist. With the breakout on the ratio charts and the bullish patterns forming, Nifty Pharma could be the Pushpa of the stock market—ready to make its own thunderous ascent.
And remember, just like Pushpa, Nifty Pharma won’t stop—jukega nahi.
Disclaimer: The purpose of this article is only to share interesting charts, data points and thought-provoking opinions. It is NOT a recommendation. This article is strictly for educative purposes only. As per SEBI guidelines, the writer and his dependents may or may not hold the stocks/commodities/cryptos/any other assets discussed here. However, clients of Definedge may or may not own these securities.
(About Author: Brijesh Bhatia has over 18 years of experience as a trader and technical analyst in India’s financial markets. He is a well-known face in the business channel as a Market Expert and has worked with broking giants like UTI, Asit C Mehta, and Edelweiss Securities. He is currently a Senior Research Analyst and Editor at Definedge.)