Why Bearings is the Sector to Watch Right Now

By Brijesh Bhatia (@bbrijesh9)
Pune, 1st December 2024: Foreign Institutional Investors (FII) continued their net selling trend in November, marking the second consecutive month of outflows from the Indian equity markets. After a significant Rs. 1.14 lakh crore withdrawal in October, November saw a further Rs. 46,000 crore exit, raising concerns among market participants. The persistent outflow has left investors grappling with uncertainty and an undercurrent of fear in the markets.
Despite the overall negative sentiment, November was not without its bright spots. While FII activity remained largely bearish, specific sectors exhibited signs of resilience, attracting investor interest. Notably, higher trading volumes in select sectors suggest that there is still an appetite for certain stocks despite the broader market headwinds.
To better understand this trend, we turned to the Sector Volume Scanner available in RZone, which is also integrated into TradePoint. While the National Stock Exchange (NSE) and Bombay Stock Exchange (BSE) do not offer comprehensive sectoral indices, the Definedge Equal Weighted Index provided valuable insights into sectors experiencing higher-than-usual trading volumes.
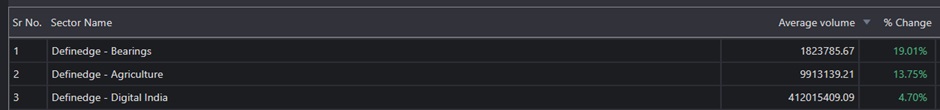
Source: RZone, Definedge
Our analysis revealed that three sectors were notably trading above their average volumes, with the Definedge-Bearings sector standing out. This spike in trading activity signals that there could be a shift or an emerging trend within these sectors, even as broader market sentiment remains cautious.
A Closer Look at the Definedge-Bearings Sector
We analysed the Definedge-Bearings sector’s chart to delve deeper into its potential.
Definedge EQW Bearing Index
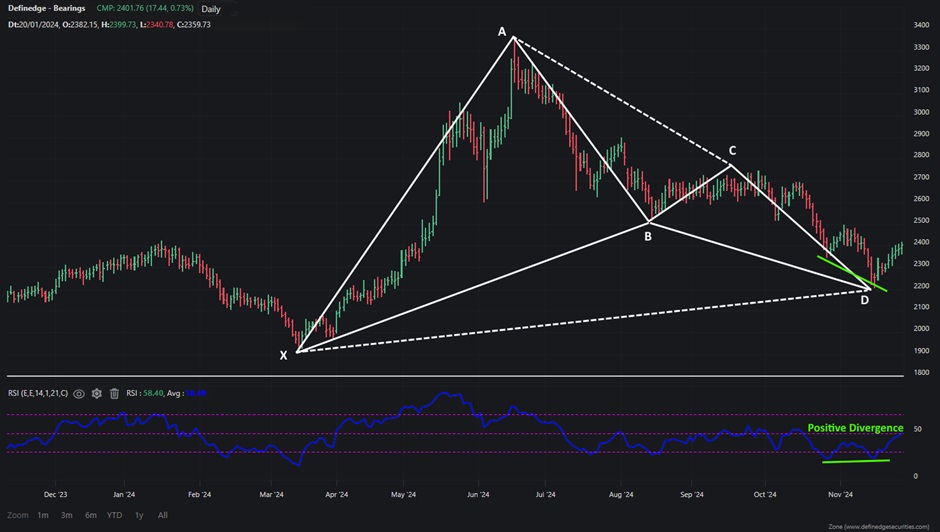
Source: RZone, Definedge
The daily chart of the Definedge Equal Weighted Bearings Index shows a Bullish Gartley Harmonic pattern, suggesting that the sector could be poised for an upward move.
Harmonic patterns, a popular tool in technical analysis, represent price structures that reflect natural market rhythms. These patterns, including the Gartley pattern, are based on Fibonacci retracements and extensions. The Bullish Gartley pattern, in particular, indicates that after a period of decline, the market is likely to reverse direction and start trending higher. This provides a potential signal for readers looking for opportunities in a market otherwise showing weakness.
The positive divergence on the Relative Strength Index (RSI) further supports the case for a potential reversal in the Definedge-Bearings sector. The RSI, a momentum oscillator, measures the speed and change of price movements. A positive divergence occurs when the price makes new lows, but the RSI forms higher lows, suggesting that downward momentum is weakening. This signals that the selling pressure may be easing, increasing the probability of a market reversal.
Conclusion
While the ongoing FII outflows indicate that caution should prevail in the broader market, November’s sector-specific analysis provides some optimism. The Definedge-Bearings sector, in particular, shows promising signs of a potential reversal, backed by the Bullish Gartley pattern and positive divergence on the RSI.
Disclaimer: The purpose of this article is only to share interesting charts, data points and thought-provoking opinions. It is NOT a recommendation. This article is strictly for educative purposes only. As per SEBI guidelines, the writer and his dependents may or may not hold the stocks/commodities/cryptos/any other assets discussed here. However, clients of Definedge may or may not own these securities.
(About Author: Brijesh Bhatia has over 18 years of experience as a trader and technical analyst in India’s financial markets. He is a well-known face in the business channel as a Market Expert and has worked with broking giants like UTI, Asit C Mehta, and Edelweiss Securities. He is currently a Senior Research Analyst and Editor at Definedge.)