4 Stocks Turning Bullish on P&F Chart

Brijesh Bhatia (@bbrijesh9)
Pune, 16th January 2025: The Indian stock markets are currently experiencing significant volatility, creating waves of fear and uncertainty among investors. January 2025, much like December 2024, has started negatively, with many market participants cautious about the road ahead. However, in every cloud, there is a silver lining.
Drawing inspiration from the Chinese concept of Yin-Yang, which suggests that there is something positive in the negative, we can, too, find opportunities amidst this bearish momentum.
Despite the prevailing uncertainty, certain stocks show promise, and it’s not just about luck; it’s about employing a well-researched strategy to identify these opportunities. The “Double Top Buy Signal on Multi-Timeframe” theory is one such strategy that can be particularly useful in volatile market conditions.
Understanding the “Double Top Bullish Pattern”
Before we discuss the methodology for identifying stocks, let’s first understand the underlying principle of the “Double Top Buy (DTB) signal,” a bullish pattern that is the cornerstone of this strategy.
The point-and-figure (P&F) charting method is a classic technique for identifying trends and chart patterns. In P&F charts, the letter ‘X’ represents uptick in price, while the letter ‘O’ represents a downward move. This method differs from traditional charts by focusing solely on price movements, ignoring time, and providing more precise signals for traders looking to make informed decisions.
The Double Top Buy or Breakout (DTB) pattern is a bullish formation that occurs when the price forms two peaks at approximately the same level.
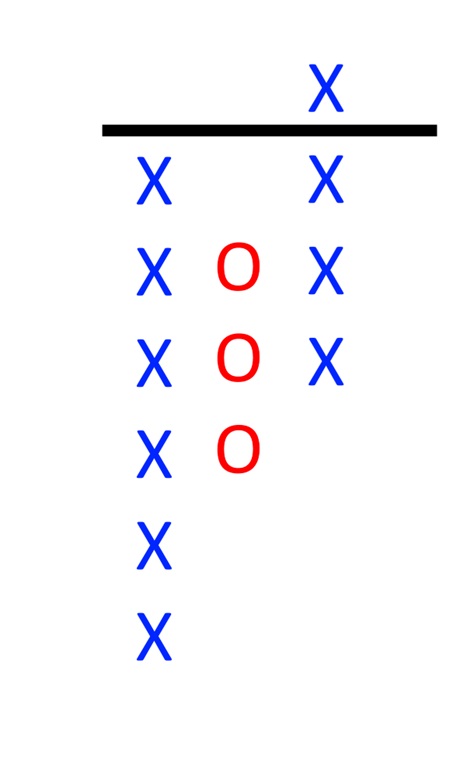
The first peak marks the initial rally, followed by a retracement (a brief pullback or correction) and then a second rally to the same level. When the price breaks above the previous peak, it signals a breakout, which typically indicates the resumption of the bullish trend.
In essence, the Double Top Breakout is a swing breakout pattern and indicates that the stock has overcome resistance and is poised to rally further. Savvy traders can capitalise on a powerful signal of potential price momentum.
The Role of Multi-Timeframe Analysis
While the Double Top Bullish Pattern on a single timeframe is effective, applying Multi-Timeframe analysis adds another layer of precision to this strategy. The multi-timeframe approach involves analysing price action across multiple timeframes to gain a clearer, more comprehensive view of the stock’s performance and the broader market conditions. This allows traders to validate the signals from shorter timeframes with the broader trend seen on longer timeframes.
For this approach, we use three specific percentage box sizes on the daily chart to refine our analysis:
- 25%
- 5%
- 1%
Each box size captures different levels of price movements and helps filter out market noise, enabling traders to focus on the most significant trends.
Additionally, the RZone scanner tool efficiently filters stocks, displaying these patterns across the selected timeframes. This scanner helps us identify the most promising candidates aligning with the Double Top Breakout pattern across the three percentage counts, ensuring that only the stocks with the most potential make it to the list.
Four Stocks with Bullish Potential in a Bearish Market
Based on the insights from our analysis, we have identified four stocks that are showing bullish signals despite the prevailing market volatility. These stocks have demonstrated the key characteristics of the Double Top Buy Breakout and are worth monitoring closely for potential opportunities:
- BSE Ltd.
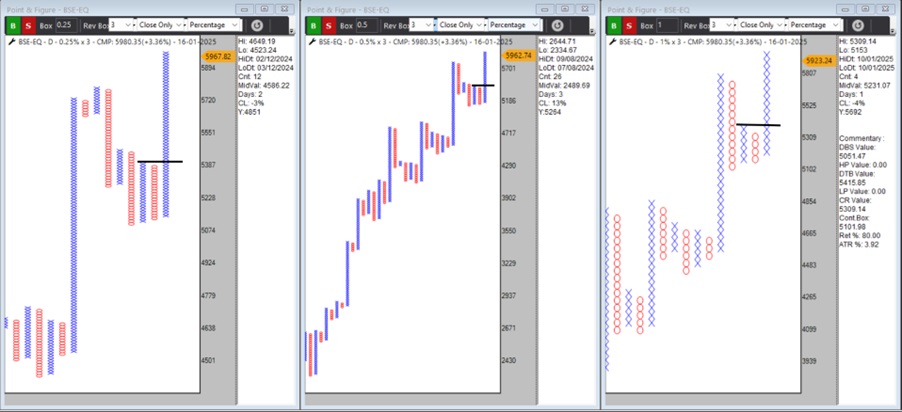
Source: TradePoint, Definedge Securities
- Industower Ltd.
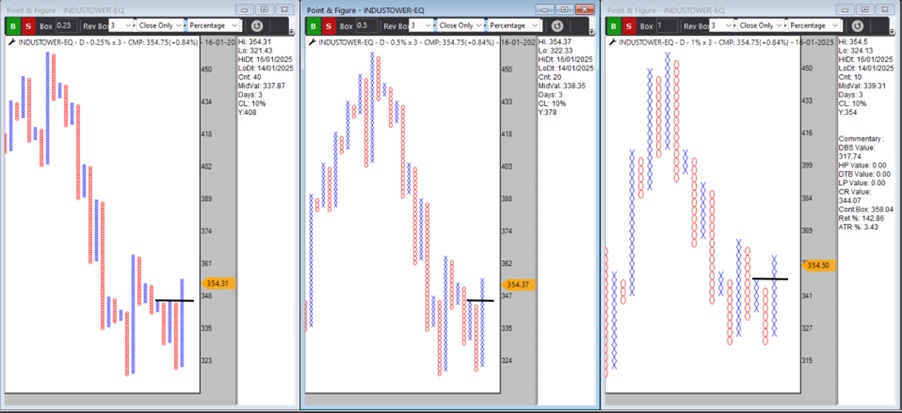
Source: TradePoint, Definedge Securities
- Adani Power Ltd.
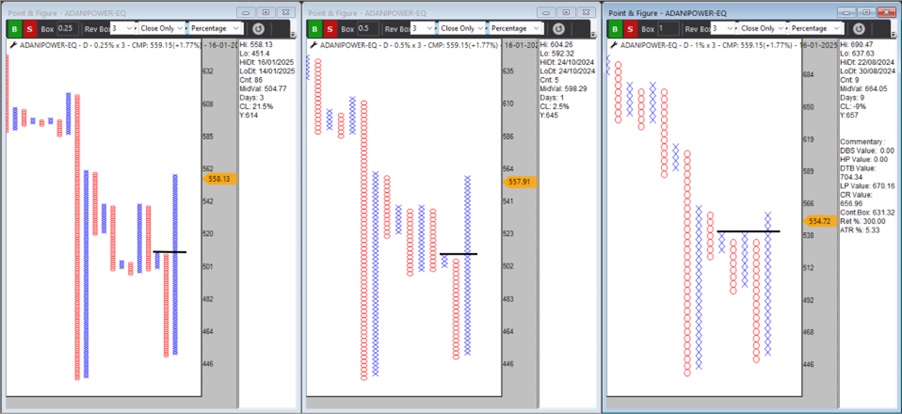
Source: TradePoint, Definedge Securities
- Aarti Industries Ltd.
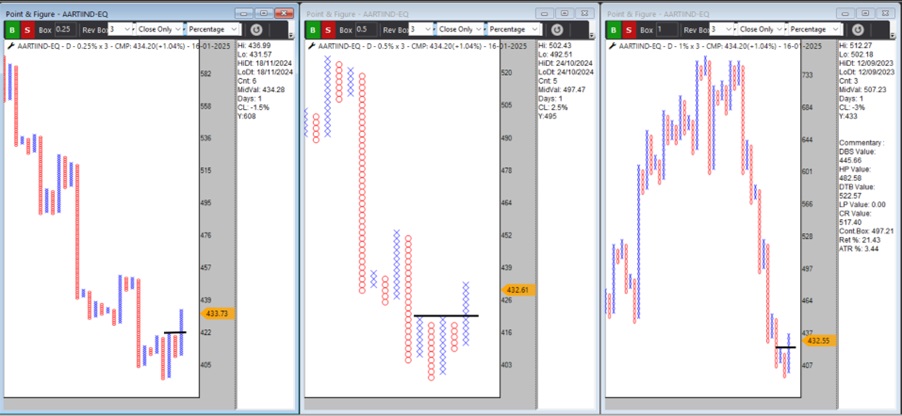
Source: TradePoint, Definedge Securities
Why These Stocks Stand Out
The common thread among these four stocks is their ability to break through previous resistance points despite the market’s overall bearish sentiment. This breakout behaviour is precisely what traders look for when searching for opportunities in turbulent times. These stocks are likely to witness further upward momentum as they establish new highs.
While the broader market may seem uncertain, it’s important to remember that volatility often presents opportunities. By applying the “Double Top on Multi-Timeframe” strategy, traders can focus on high-potential stocks that are breaking out, even in a downtrend.
Disclaimer: The purpose of this article is only to share interesting charts, data points and thought-provoking opinions. It is NOT a recommendation. This article is strictly for educative purposes only. As per SEBI guidelines, the writer and his dependents may or may not hold the stocks /commodities/ cryptos/any other assets discussed here. However, clients of Definedge may or may not own these securities.
(About Author: Brijesh Bhatia has over 18 years of experience as a trader and technical analyst in India’s financial markets. He is a well-known face in the business channel as a Market Expert and has worked with broking giants like UTI, Asit C Mehta, and Edelweiss Securities. He is currently a Senior Research Analyst and Editor at Definedge.)