5 Stocks to Add to Your Watchlist in the Stock Market Crash

Author: Brijesh Bhatia (bbrijesh9/X)
Pune, 14 November 2024: When it comes to investing, the first question many ask is, “What does the company do and is it undervalued?” The answer to this question would fit into the realm of fundamental analysis, where investors analyse a company’s financials, business models, and growth potential. But what if I told you there is a way to apply a similar rigour and precision using purely technical analysis?
Many investors shy away from technical analysis, believing it to be a complex and inaccessible field. However, technical analysis can provide a roadmap for making informed investment decisions when understood and applied correctly.
This article will explore a strategy that uses technical indicators simply yet effectively. I call this strategy BOLD BULLS.
This strategy uses a key technical indicator called the Relative Strength Index (RSI), but not in the traditional overbought/oversold sense.
Instead, we will focus on identifying stocks with strong momentum, leveraging Multi-Timeframe Analysis to capture trends and maximise returns.
Let me explain how the BOLD BULLS strategy works, starting with the RSI and how we can use it across multiple timeframes to identify investment opportunities.
Understanding the Relative Strength Index (RSI)
Before diving into the strategy, it’s essential to understand the RSI and how it works. The RSI is a momentum oscillator developed by J. Welles Wilder in 1978. It measures the speed and change of price movements and is typically used to identify whether a stock is overbought or oversold.
The RSI oscillates within a scale of 0 to 100, where:
– A reading above 70 typically indicates that the stock is overbought, suggesting it might be vulnerable to a price or time correction.
– A reading below 30 typically indicates that the stock is oversold, which may signal a potential reversal or a consolidation in price.
However, the BOLD BULLS strategy takes a different approach. Instead of using RSI to look for overbought or oversold conditions, we focus on using the RSI above 60 as a proxy for strong momentum in an uptrend. The idea is to play the trend rather than trying to predict reversals, which can be more volatile and unpredictable.
In this strategy, we use multi-timeframe analysis to better understand the trend, momentum, and strength of price action over various time intervals.
Multi-Timeframe Analysis: A Powerful Tool for Identifying Trends
Multi-timeframe analysis involves analysing a stock’s price action across several timeframes, such as monthly, weekly, and daily charts. Each timeframe provides a different perspective on the stock’s movement:
Monthly chart: This timeframe shows the stock’s long-term trend. A strong trend on the monthly chart indicates a solid underlying trend that has been sustained over time.
Weekly chart: The weekly chart provides a mid-term view, showing how the stock has performed in the medium term (weeks to months). It allows you to assess whether the trend on the monthly chart is being confirmed or if there are signs of reversal.
Daily chart: The daily chart helps us zoom in on the stock’s short-term momentum. It reveals the stock’s daily fluctuations and momentum, allowing us to pinpoint precise entry points.
The key benefit of using multi-timeframe analysis is that it helps filter out “noise” and gives you a holistic view of the market. If a stock is in a strong uptrend across all three timeframes, it’s likely to continue trending in the same direction, increasing the likelihood of a profitable trade.
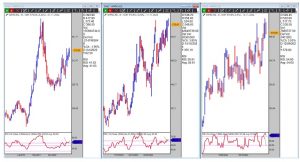
Here is the chart of the strategy:
The BOLD BULLS Strategy
Now that we understand the importance of RSI and multi-timeframe analysis let’s dive into the BOLD BULLS strategy. The rules are simple and easy to follow:
System Rules
1. Entry Signal: When the RSI on the Monthly, Weekly, and Daily charts are above 60, we enter a trade.
2. Exit Loss (Stop Loss): We set a stop loss at 15% below the entry price. If the stock falls by this amount from our purchase price, we exit the position to limit our losses.
3. Exit Profit (Target Price): Sell 50% of the shares bought at 35% profit. Sell the remaining 50% quantity at 50% profit from the entry price. Once the stock reaches this gain level, we exit the position to lock in profits.
Finding Stocks That Fit the Criteria
To find stocks that meet the criteria for the BOLD BULLS strategy, you can use RZone by Definedge, a powerful tool for screening stocks based on multiple technical indicators.
Advantages of the BOLD BULLS Strategy
1. Trend Following: The BOLD BULLS strategy helps you stay aligned with the market trend, which is the best way to capture profits in trending stocks.
2. Simple and Easy to Implement: The rules are straightforward, and the strategy requires minimal technical knowledge. You don’t need to be a professional trader to use it effectively.
3. Balanced Risk-Reward: With a 15% stop loss and a 35-50% profit target, the strategy offers a favourable risk-reward ratio, allowing you to make significant profits while limiting potential losses
4. Multi-Timeframe Confirmation: By using multiple timeframes, you can confirm the strength and sustainability of a trend, increasing your chances of success.
Here is the list of the stocks that qualified the Bold Bulls criteria from the Nifty200 index:
⦁ Coforge
⦁ Federal Bank
⦁ HCL Tech
⦁ Indian Hotel
⦁ Wipro
*Note these stocks qualified as per closing of 11th November 2024.
The BOLD BULLS strategy is a simple yet powerful way to apply technical analysis to identify and ride strong trends for substantial profits. By focusing on the RSI across multiple timeframes (monthly, weekly, and daily), you can effectively filter out weaker stocks and focus on those with strong momentum.
This strategy works well for both beginner and experienced traders. It provides clear entry and exit points and a disciplined approach to risk management.
Happy investing, and always combine technical analysis with sound risk management to achieve long-term success.
Disclaimer: The purpose of this article is only to share interesting charts, data points and thought-provoking opinions. It is NOT a recommendation. This article is strictly for educative purposes only.
As per SEBI guidelines, the writer and his dependents may or may not hold the stocks/commodities/cryptos/any other assets discussed here. However, clients of Definedge may or may not own these securities.
About Writer:
Name: Brijesh Bhatia
Twitter Handle: @bbrijesh9
Bio: Brijesh Bhatia has over 18 years of experience as a trader and technical analyst in India’s financial markets. He is a well-known face in the business channel as a Market Expert and has worked with broking giants like UTI, Asit C Mehta, and Edelweiss Securities. He is currently a Senior Research Analyst and Editor at Definedge.