91 Percent Pollutants In Pune Air Due To Vehicles: IITM Inventory Report
Manasi Saraf Joshi
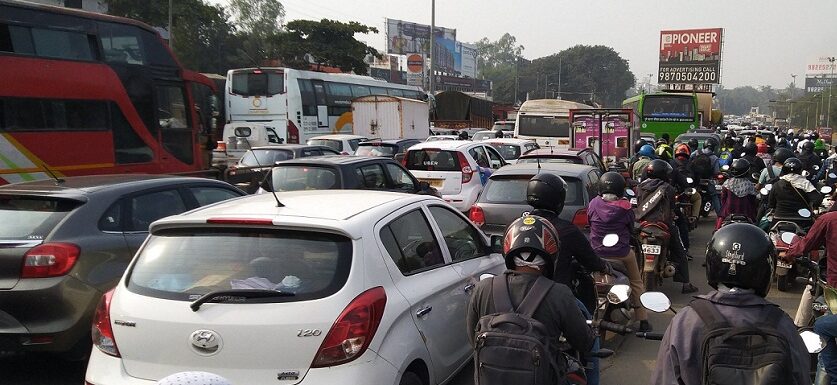
Pune, 22nd May 2021: The emission inventory report of Pune city showed that 91 percent of the pollution in Pune air is due to vehicle emissions. There has been an increase by 70 percent in Particulate matter (PM) 2.5 while 61 percent in PM 10 in the last seven years. Apparently, controlled measures by the industries have shown affirmative results.
Noting of the report
“Transportation sector is found to be the major contributor in PM2.5 emissions as compared to the other sources. Though industrial production has increased over the years, emissions show a minimal rise. This might be due to the improved fuel quality used in units, efficient technological innovations and stringent enforcement of standards. Similarly, a significant increase is observed in the emissions of Organic Carbon (81.3%), NOx (72.8%), and VOCs (69.8%). Sulfur dioxide emissions show a 30.2% increase, lowest amongst the eight pollutants considered in this work”, the report suggested.
A comparison of earlier (2012-13) emission inventory with the current (2019-20) inventory in PMR suggests a significant increase in Pune’s overall emission load. The air quality of Pune is mainly regulated by particulate pollutants (PM2.5 and PM10). A significant growth in the emissions of particulate pollutants has been observed during the past seven years. An increase of 70% and 61% is found in PM2.5 and PM10 respectively from 2012-13 to 2019-20. There has been an enormous growth in the number of vehicles in PMR during the past decade.
The emission estimates in such high resolution by SAFAR are likely to serve as an essential information base for scientists, policymakers and NCAP program of CPCB. This report also provides the rate of change in anthropogenic emissions of atmospheric constituents during the past seven years.
Percentage Change in PM10 & PM2.5 Emissions during Past 7yrs (2012-13 to 2019-20)
| Sectors | PM10 | PM 2.5 |
| Transportation | 87.9% | 91.0% |
| Industrial | 33.8% | 32.9% |
| Residential | 107.7% | 57.9% |
| WBR Dust | 49.5% | 38.1% |
| Other | NA | NA |
| Total | 61.3% | 70.0% |
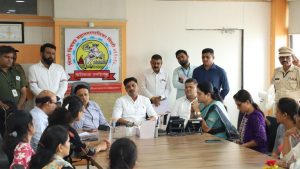
The inventory report was made by Indian Institute of Tropical Meteorology based on seven years data from 2013 to 2020. The report was released on Friday by Savitribai Phule Pune University vice-chancellor Nitin Karmalkar in the presence of IITM director Prof. Ravi Nanjundiah, lead author Prof Gufran Beig who’s the founder project director of SAFAR, Dr BS Murthy and Prof. Gosavi.
How the inventory was done?
The emission inventory campaign was IITM Pune under the Ministry of Earth Sciences along with SPPU and under the expert advice of Prof. Saroj Kumar Sahu of Utkal University. Geographical Information System (GIS)-based statistical emission model developed by the scientist of IITM was used to develop fine resolution of 400m gridded products.
Around 6 months long emission inventory campaign involving more than 200 students from IITM, SPPU and Utkal University was carried out during 2019-20 in the Pune Metropolitan region including Pune, Pimpri and Chinchwad regions with around 2,50,000 hours of work. This exercise was to collect real-time primary activity data of 26 different local sources of air pollution.
The click counters, low volume samplers and various survey forms were used to get activity accounting. This exercise was earlier done in 2012-13 at the advent of SAFAR system with a resolution of 1km. Since then significant changes have occurred in land use and demography and many new sources, which were earlier ignored, have now been quantified.
“Emission inventory is a scientific way to identify aggregated local source contribution and their region-specific spatial distribution within a confined boundary like PMR. It is a more effective tool to identify hot spots and plan control measures. The focus of the present campaign was more towards various small sectors/factors like the condition of the road, the pattern of transport flow from surrounding regions, fast moving-slow moving-stagnant traffic scenario, uninformed sector, construction activity, aviation, practices by immigrant works, hospital rush and vehicles from outside state, changing lifestyles/cooking habit etc. These will be in addition to traditionally dominating sectors like transport, Industry, residential cooking, Power, suspended dust, trash burning, etc.”, IITM stated.