3 Stocks with the Bullish Follow-Through Pattern on Charts

Author – Brijesh Bhatia (@bbrijesh9)
Pune, 03 February 2025: Trading and technical analysis require skills, and there are 1000s of patterns in the technical analysis, but specific patterns emerge as highly valuable indicators of strong momentum and potential trading opportunities. One such pattern is the Bullish Anchor Follow Through (AFT), a pattern pioneered by Definedge, which highlights stocks with significant bullish momentum and the potential for the continuation of the momentum. Understanding this pattern, how it works, and how it applies to specific stocks can significantly enhance the effectiveness of trading strategies.
Understanding the Bullish Anchor Follow-Through (AFT) Pattern
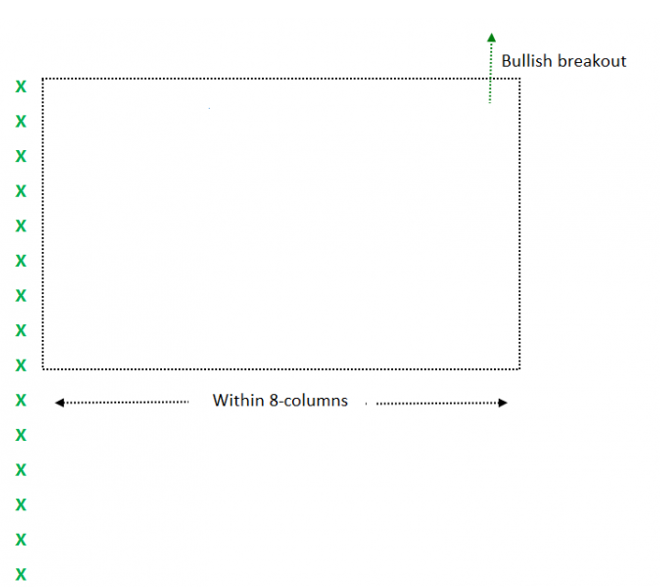
The Bullish AFT pattern is based on a concept that involves two major components:
- Anchor Column (Bullish) – This represents a strong bullish movement, typically shown as a sharp price increase, indicating that the stock has seen significant upward momentum.
- Follow-Through Breakout—The breakout happens after the anchor column, and it is critical. It helps to identify that the stock has not only moved higher but that there is continued momentum in the direction of the trend. This phase is where a trader would look for trade opportunities.
The AFT pattern captures stocks amid a strong bullish move and is likely to continue upward. This continuation is usually seen after a consolidation or corrective phase, often referred to as a Double Top Buy Pattern.
Key Points of the Bullish AFT Pattern:
- The Anchor Column marks the beginning of the strong bullish movement.
- The Follow-Through phase indicates that the momentum continues and the stock will likely keep climbing.
- The Double Top Buy Pattern forms within a specified number of columns, which signifies the potential for a continuation breakout.
- The breakout typically happens without the price breaking the low of the anchor column.
The Impact of Bullish AFT in Trending Markets
The Bullish AFT pattern helps traders identify stocks in the midst of a strong upward trend. Still, it also signals that the stock has successfully consolidated or corrected in a way that prepares it for an even more decisive move. It’s often compared to other continuation patterns, such as:
- Flags
- VCP (Volume Contraction Patterns)
Both flag patterns and VCPs indicate stocks experiencing a temporary consolidation or correction before resuming their upward trajectory. When these patterns appear within the AFT framework, they further confirm that the stock is poised for continued growth.
Combining AFT with other breakout patterns gives traders multiple signals to identify high-potential trades. When scanning for the Bullish AFT pattern, traders effectively identify bullish stocks showing signs of being in the early stages of a significant breakout.
Three Stocks with Bullish AFT from the Nifty500 Basket
With the market on the verge of a potential reversal, scanning for Bullish AFT patterns from a medium-term perspective is a strategic approach to identifying stocks that could continue to rise as the market trend evolves.
Using RZone by Definedge, we scan the stocks based on the Daily 1% X 3 chart; the following three stocks from the Nifty500 basket show strong bullish momentum and meet the criteria for the Bullish AFT pattern:
- Max Health
Max Health, a prominent healthcare company, is currently exhibiting a strong bullish momentum, supported by the Bullish AFT pattern.
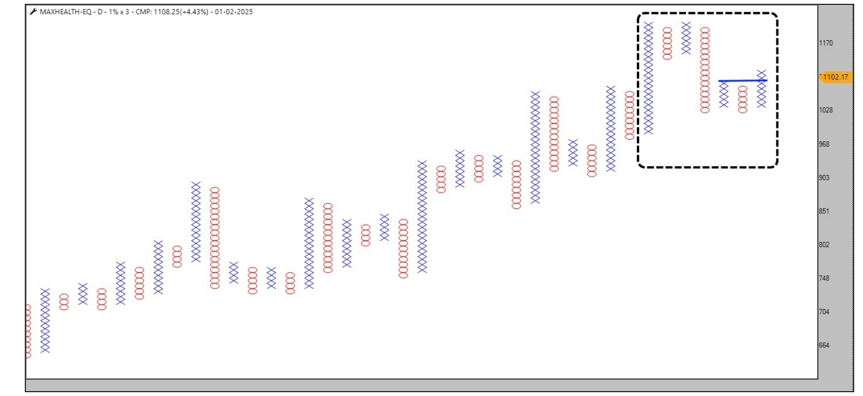
Source: TradePoint, Definedge Securities
- Phoenix Ltd
Phoenix Ltd, a leading player in the real estate sector, has shown remarkable strength in its price action. The Bullish AFT pattern is evident on the chart, where after the initial anchor column, the stock has followed up with continued breakouts.
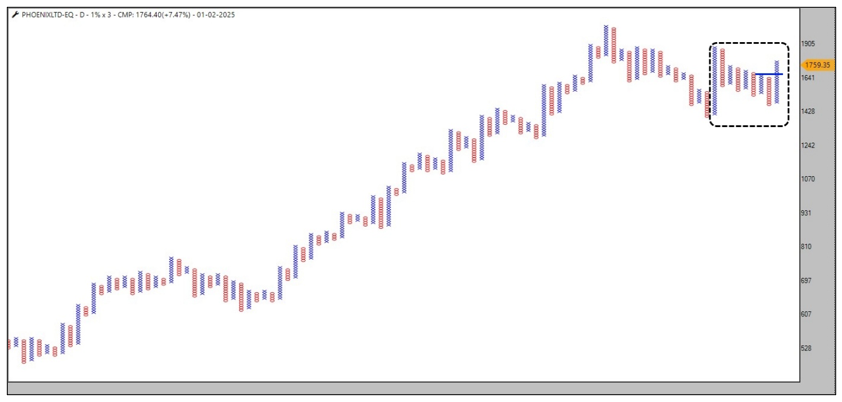
Source: TradePoint, Definedge Securities
- UBL (United Breweries Ltd)
The well-known beverage giant United Breweries has also formed a strong Bullish AFT pattern. The company has shown consistent upward movement, with a bullish anchor column and a clean follow-through breakout.
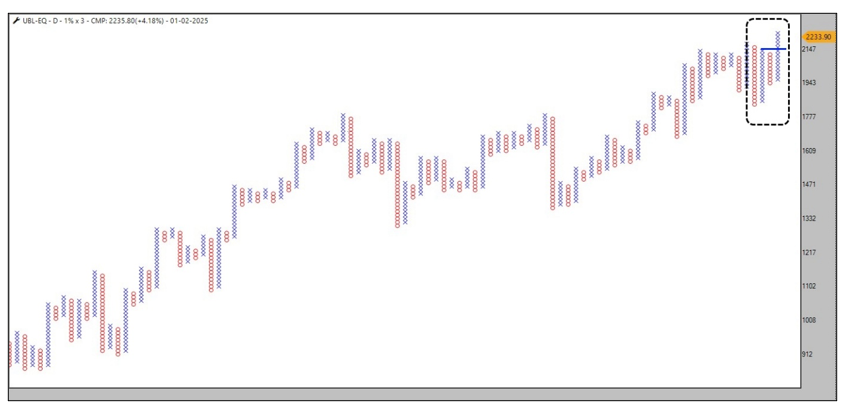
Source: TradePoint, Definedge Securities
In the current market, stocks like Max Health, Phoenix Ltd, and UBL have demonstrated a clear Bullish AFT pattern, suggesting that they are in the midst of a bullish breakout and could potentially be poised for further upward movement. Traders looking to capitalise on medium-term trends may want to consider these stocks as part of their strategic trading plans.
The Trader’s Nest by Definedge
If you are eager to learn more about such patterns and other advanced technical analysis tools, Definedge is launching Online Trader’s Nest. This platform is designed for stock market enthusiasts who want to deepen their understanding of these techniques and gain hands-on experience applying them.
Trader’s Nest will offer:
- Comprehensive lessons on Point & Figure, Options Trading and Relative Strength Analysis.
- Access to advanced scanning tools like the RZone scanner.
- Insights into the latest market trends and how to capitalise on them.
If you are interested in learning more, check out the details and sign up for updates on the upcoming Online Trader’s Nest from Definedge!
Disclaimer: The purpose of this article is only to share interesting charts, data points and thought-provoking opinions. It is NOT a recommendation. This article is strictly for educative purposes only.
As per SEBI guidelines, the writer and his dependents may or may not hold the stocks/commodities/cryptos/any other assets discussed here. However, clients of Definedge may or may not own these securities.
About Writer:
Brijesh Bhatia has over 18 years of experience as a trader and technical analyst in India’s financial markets. He is a well-known face in the business channel as a Market Expert and has worked with broking giants like UTI, Asit C Mehta, and Edelweiss Securities. He is currently a Senior Research Analyst and Editor at Definedge.